- Engine
- No-repaint MA color zones
- MA types
- 8 — EMA · SMA · WMA · HMA · DEMA · TEMA · VWMA · TMA
- Price input
- Close · HL2 · HLC3 · OHLC4
- Moving averages
- 4, independent periods
- Days to show
- Limit how far back it draws
- Lines
- 4, show / hide each
- Per line
- Own color
- Period
- Set per moving average
- Zones
- 3 (between consecutive MAs)
- Per zone
- Color + opacity %, toggle each
- Fill
- Shaded between the MA pairs
- Bar coloring
- Bullish · bearish · neutral
- Bullish / bearish
- Above / below all MAs
- Neutral
- Inside the zones
- Types
- 4 — one per moving-average cross
- Cooldown
- Adjustable (seconds)
- Chart types
- Tick · min · volume · range · Renko
- Instruments
- Any — no volume required
- Platform
- NinjaTrader 8
- License
- Free — yours to keep
- Updates
- Free, lifetime
- Version
- 1.0 — 25 Jun 2026
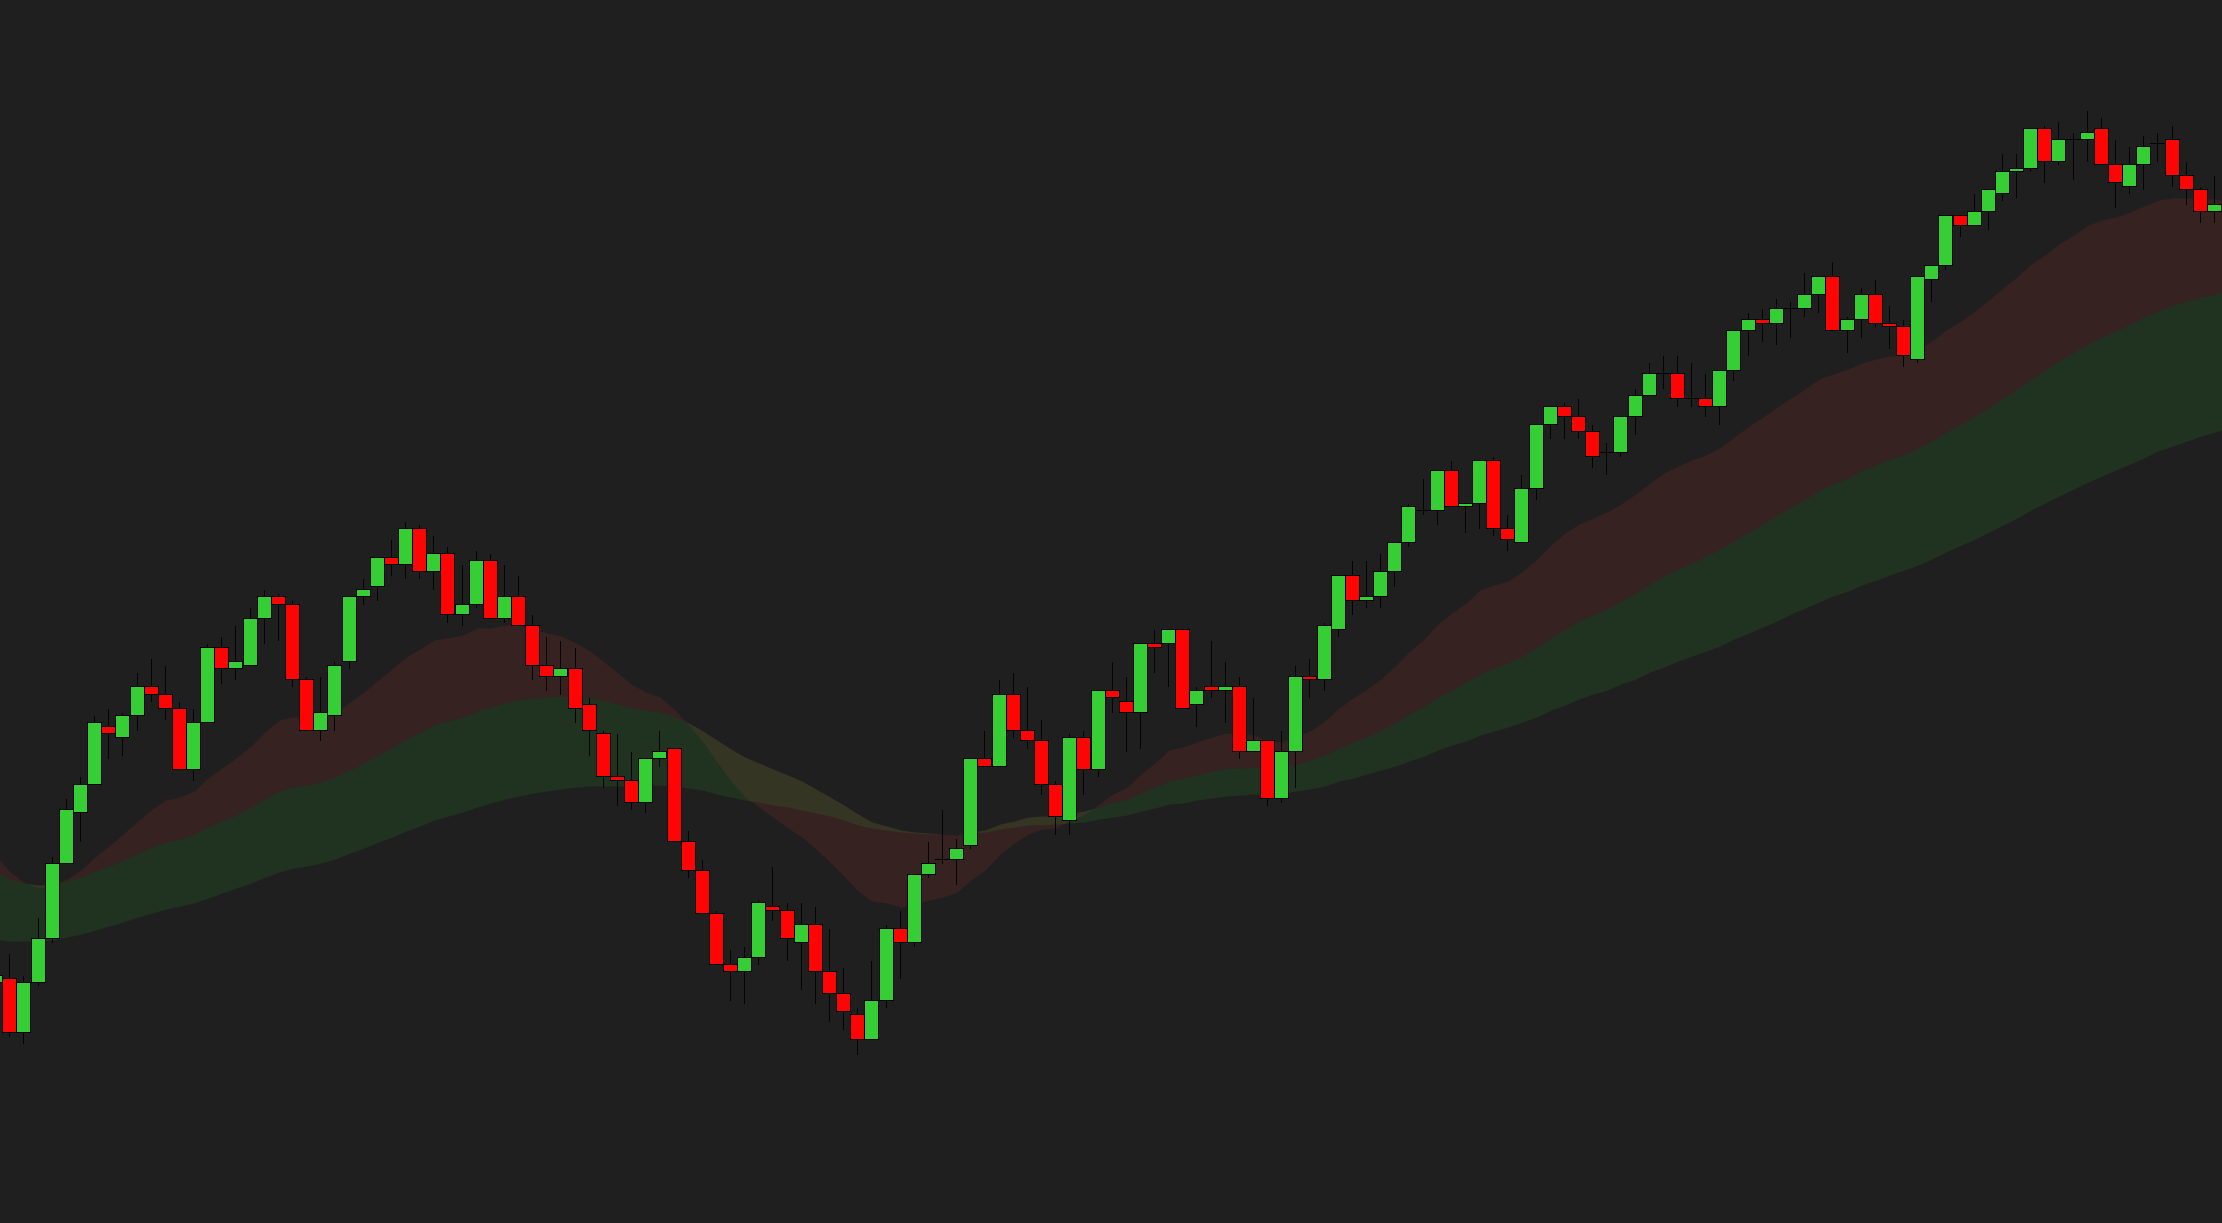
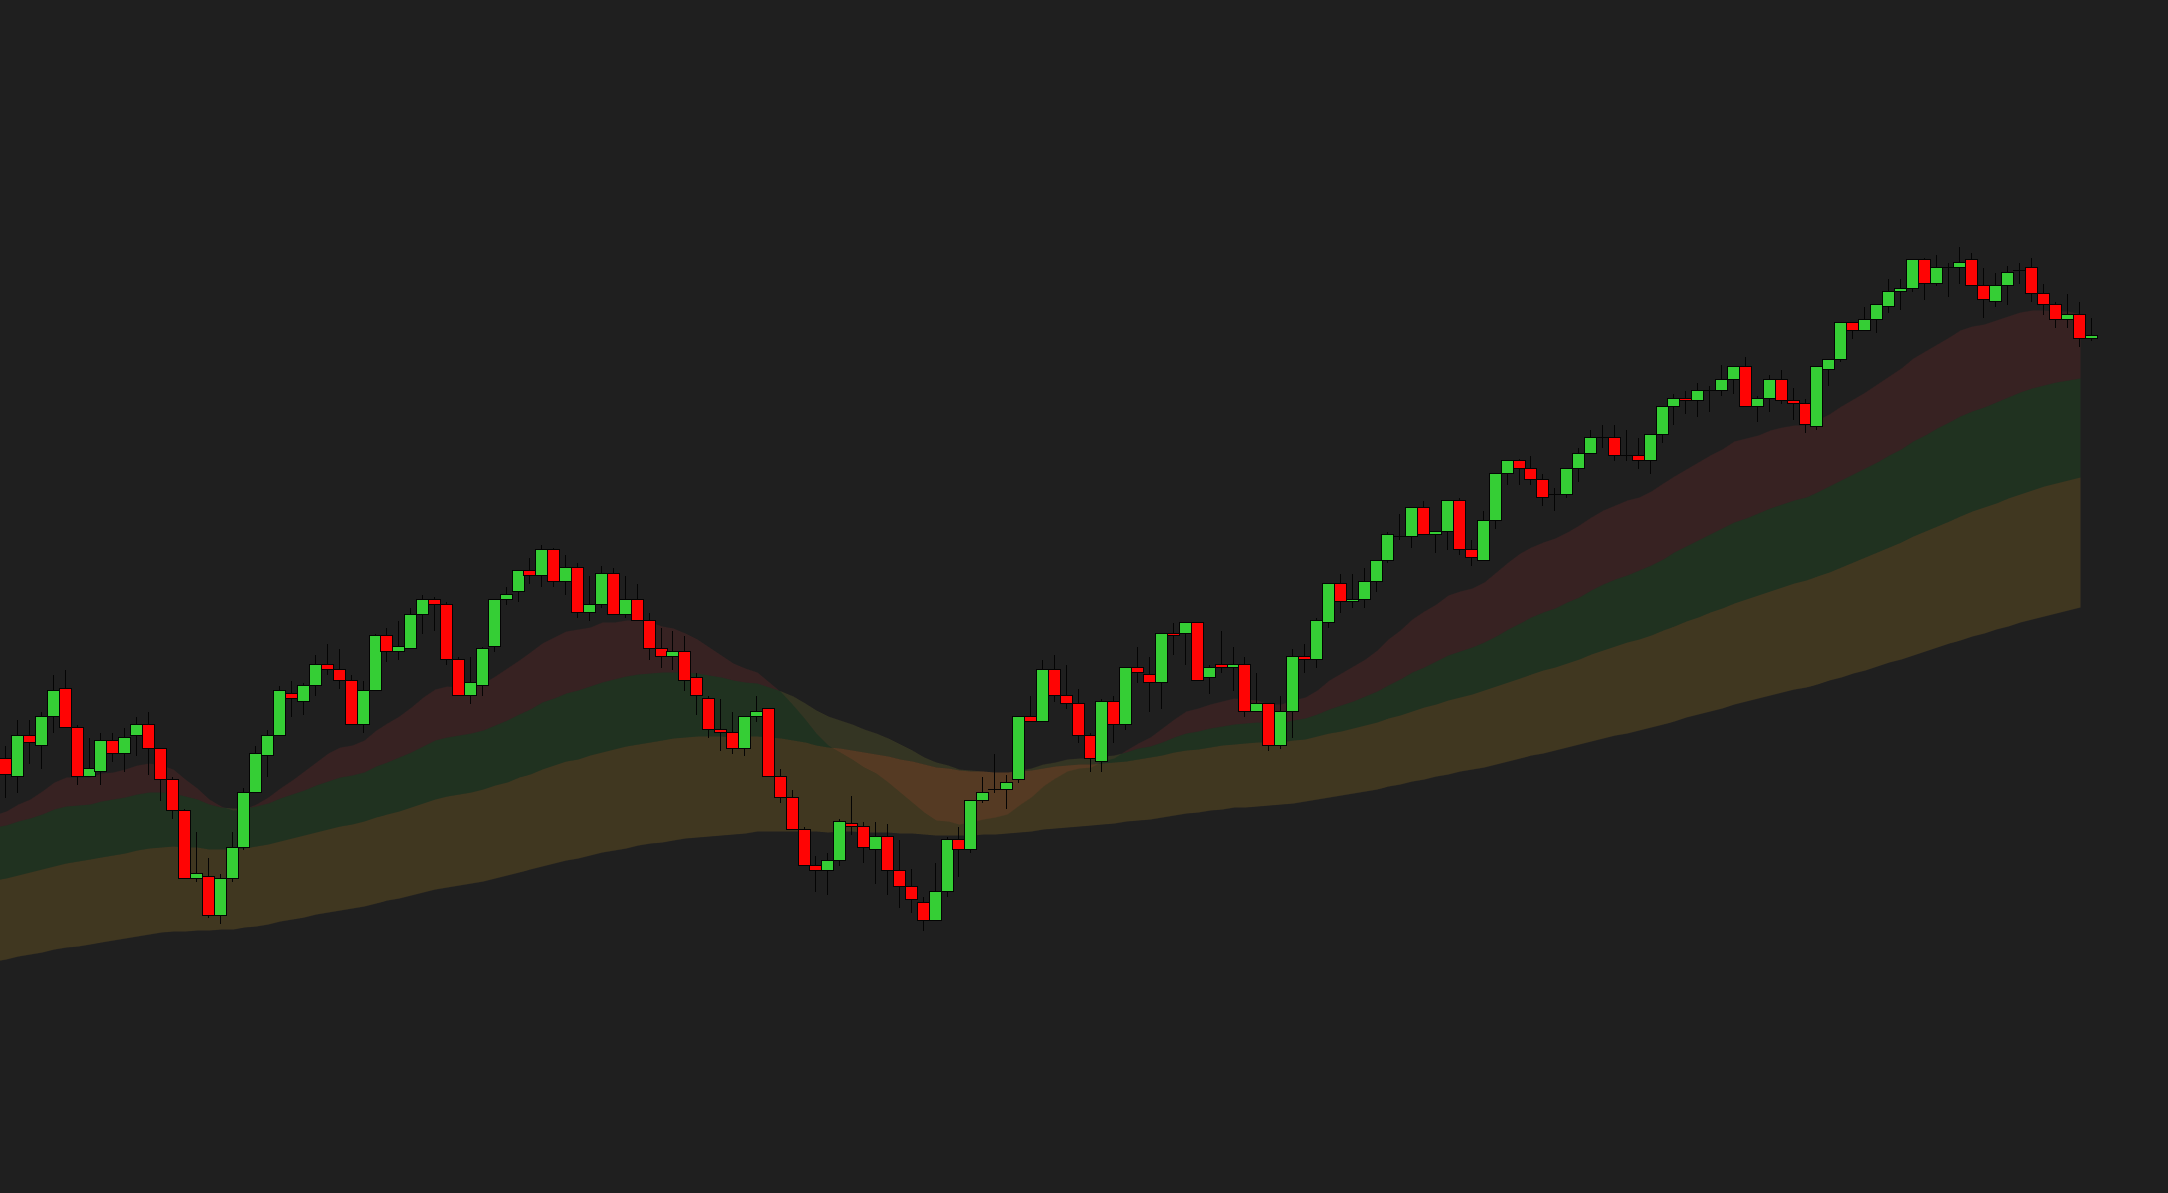
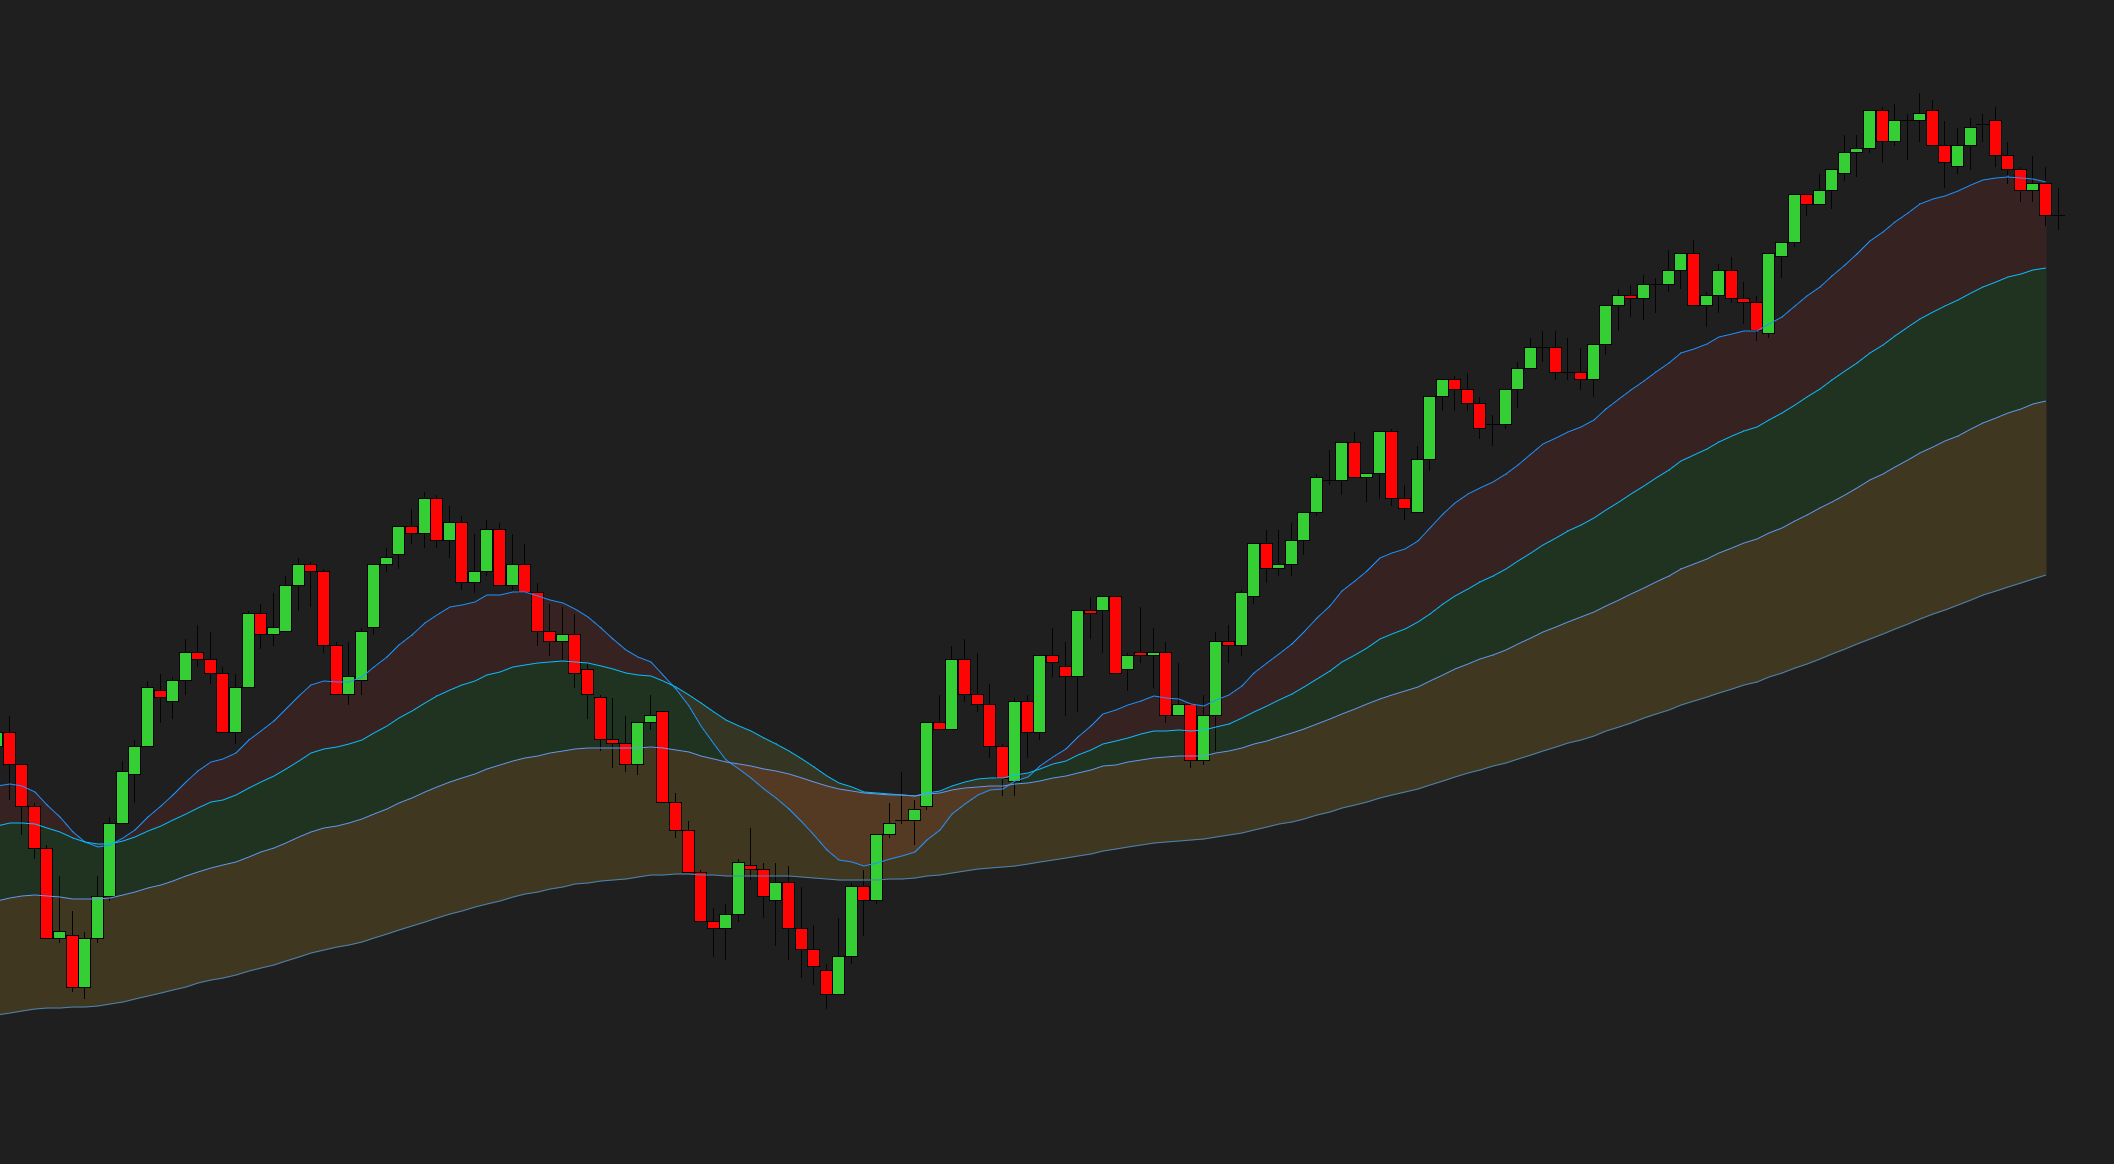
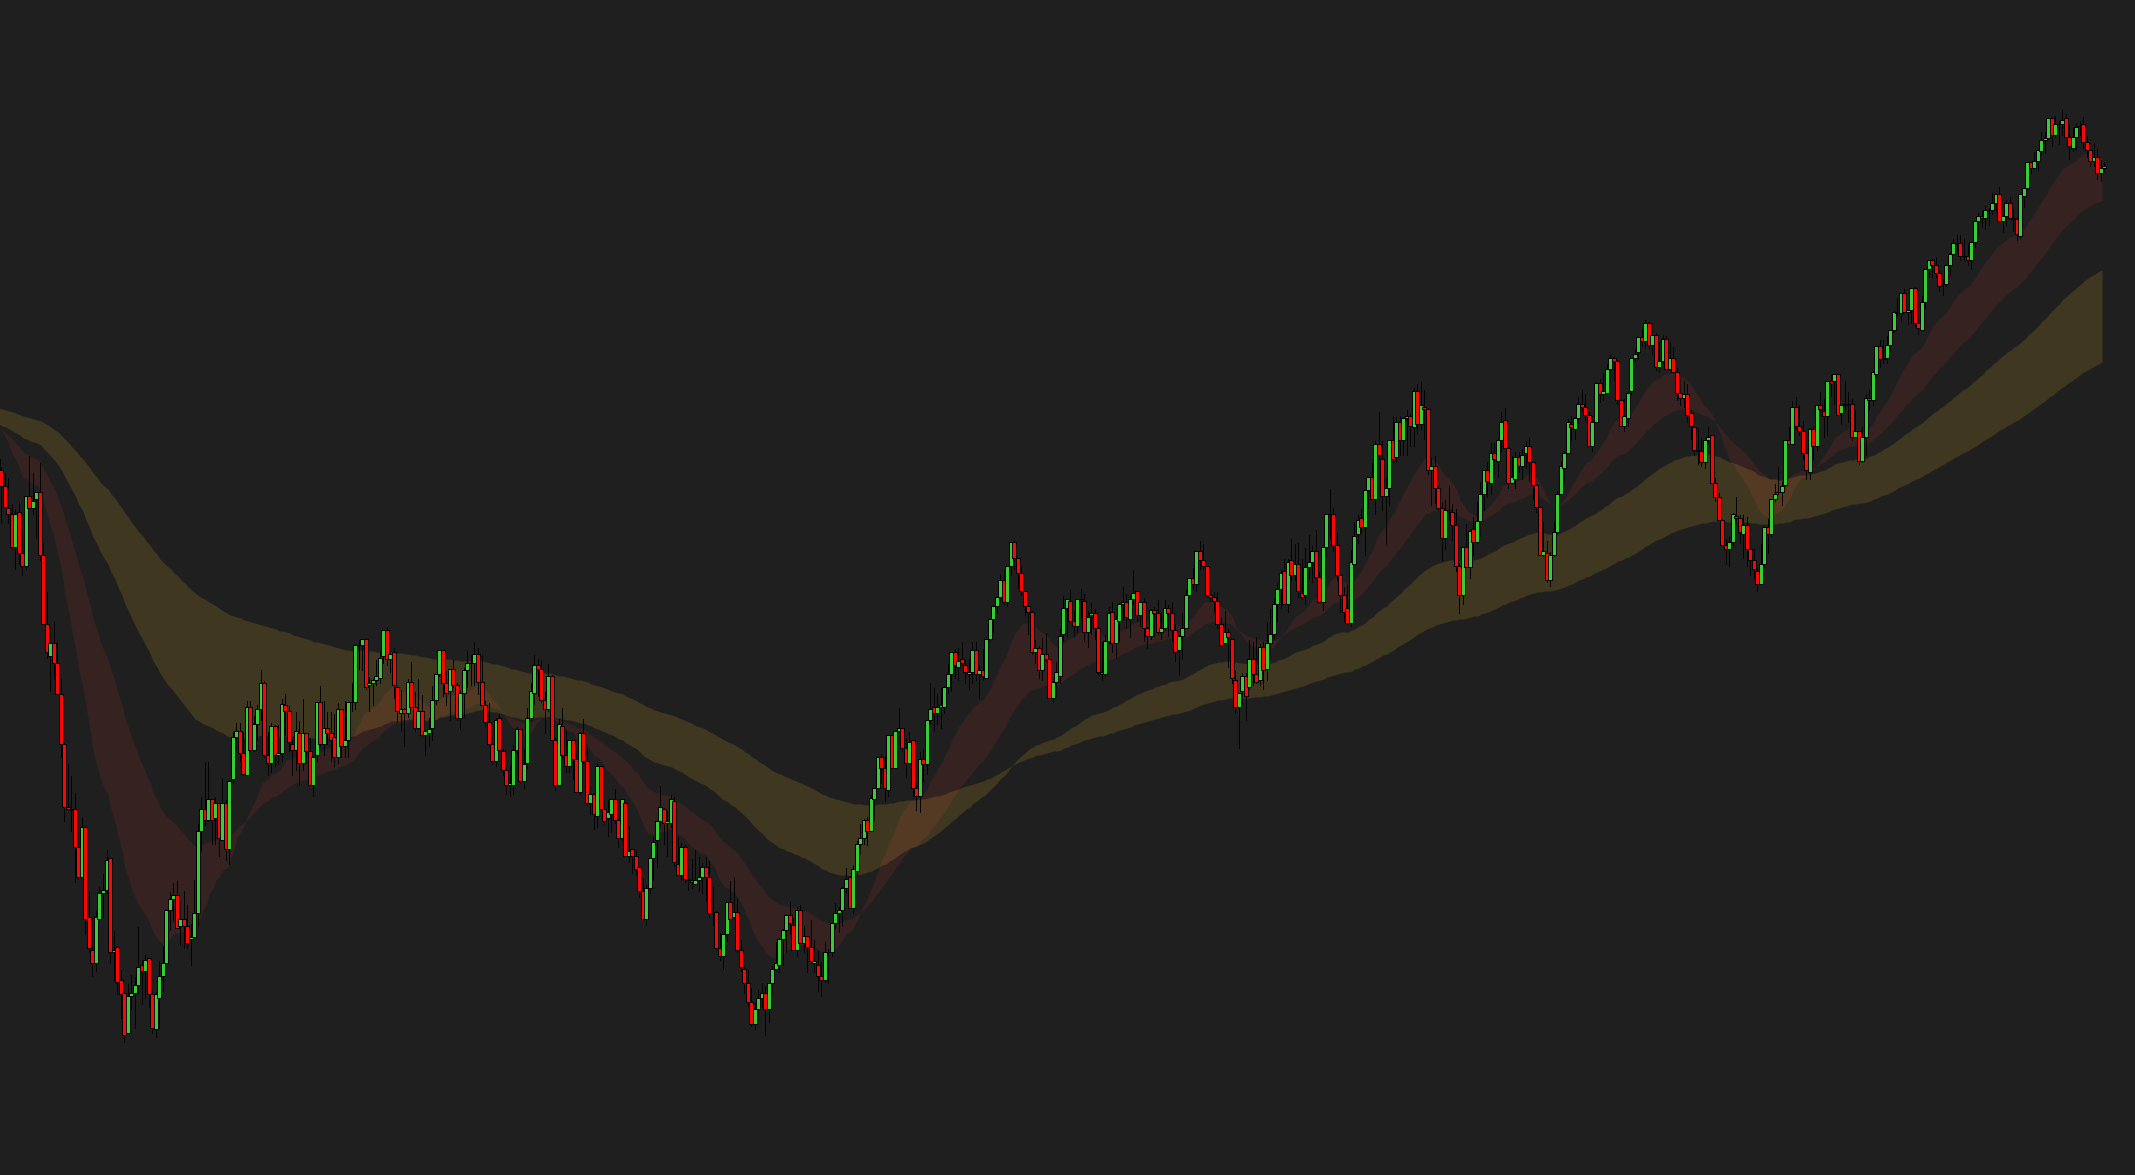
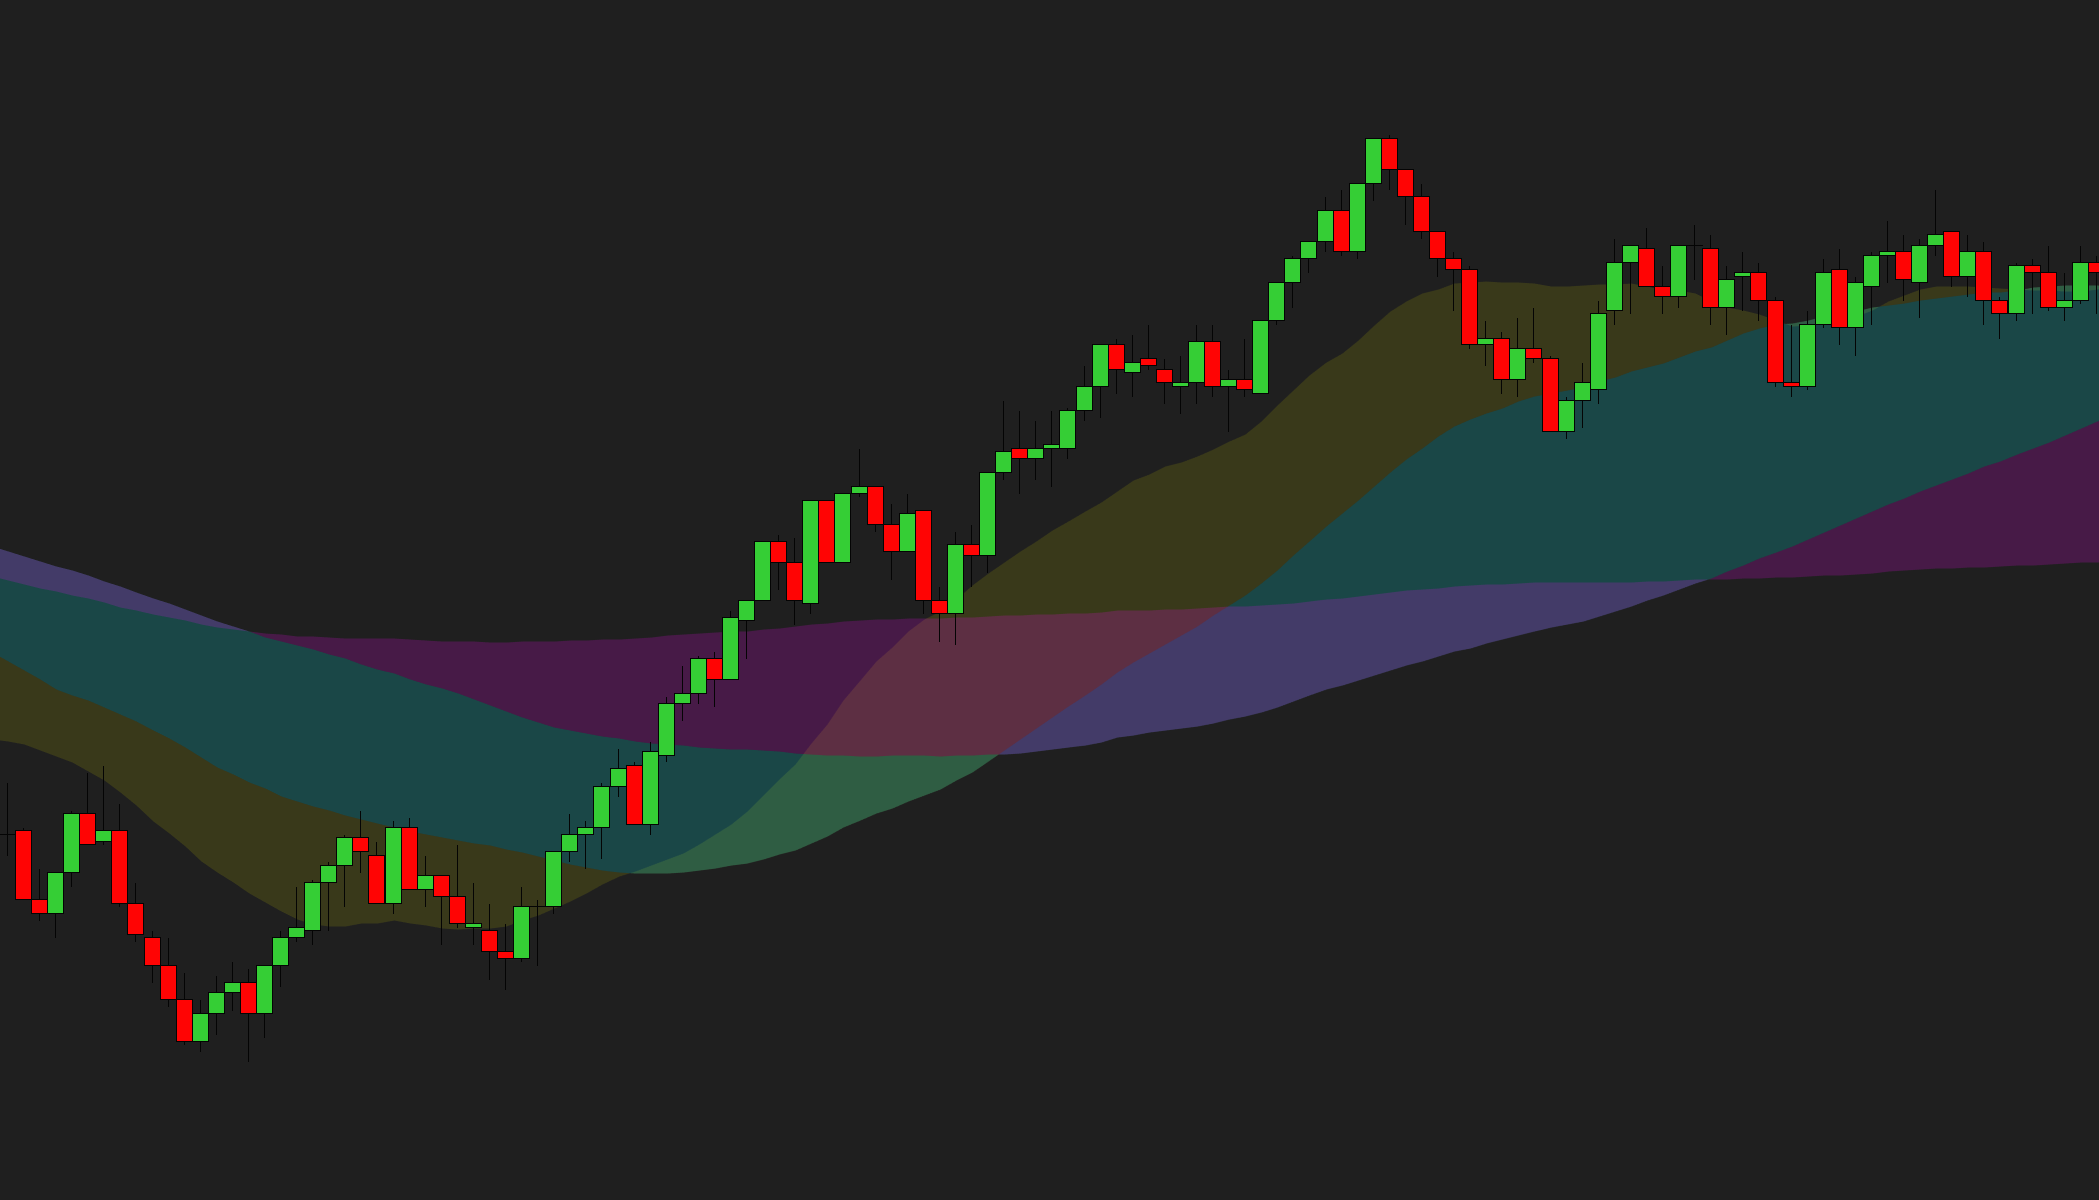
A color zone — also called an EMA cloud or moving average ribbon — is the shaded area between two moving averages. The indicator calculates each average from your settings, then fills the space between them with color — four averages, three zones, each built from exactly the values you choose: your periods, your price input (close, HL2, HLC3 or OHLC4), and any of eight MA types — EMA, SMA, WMA, HMA, DEMA, TEMA, VWMA or TMA.
Set it up the way you read the market — fast scalping averages or slow swing ones — and instead of squinting at which line crossed which, you just see it: zones stack and widen when price is trending, and compress into a flat neutral band when the averages converge.
Color zones make a natural reference point for entries and exits — the touch of a zone, the bounce off it, or the break through it. They sit cleanly alongside your other indicators or your strategy, so you can act at the exact thresholds you've defined instead of eyeballing it.
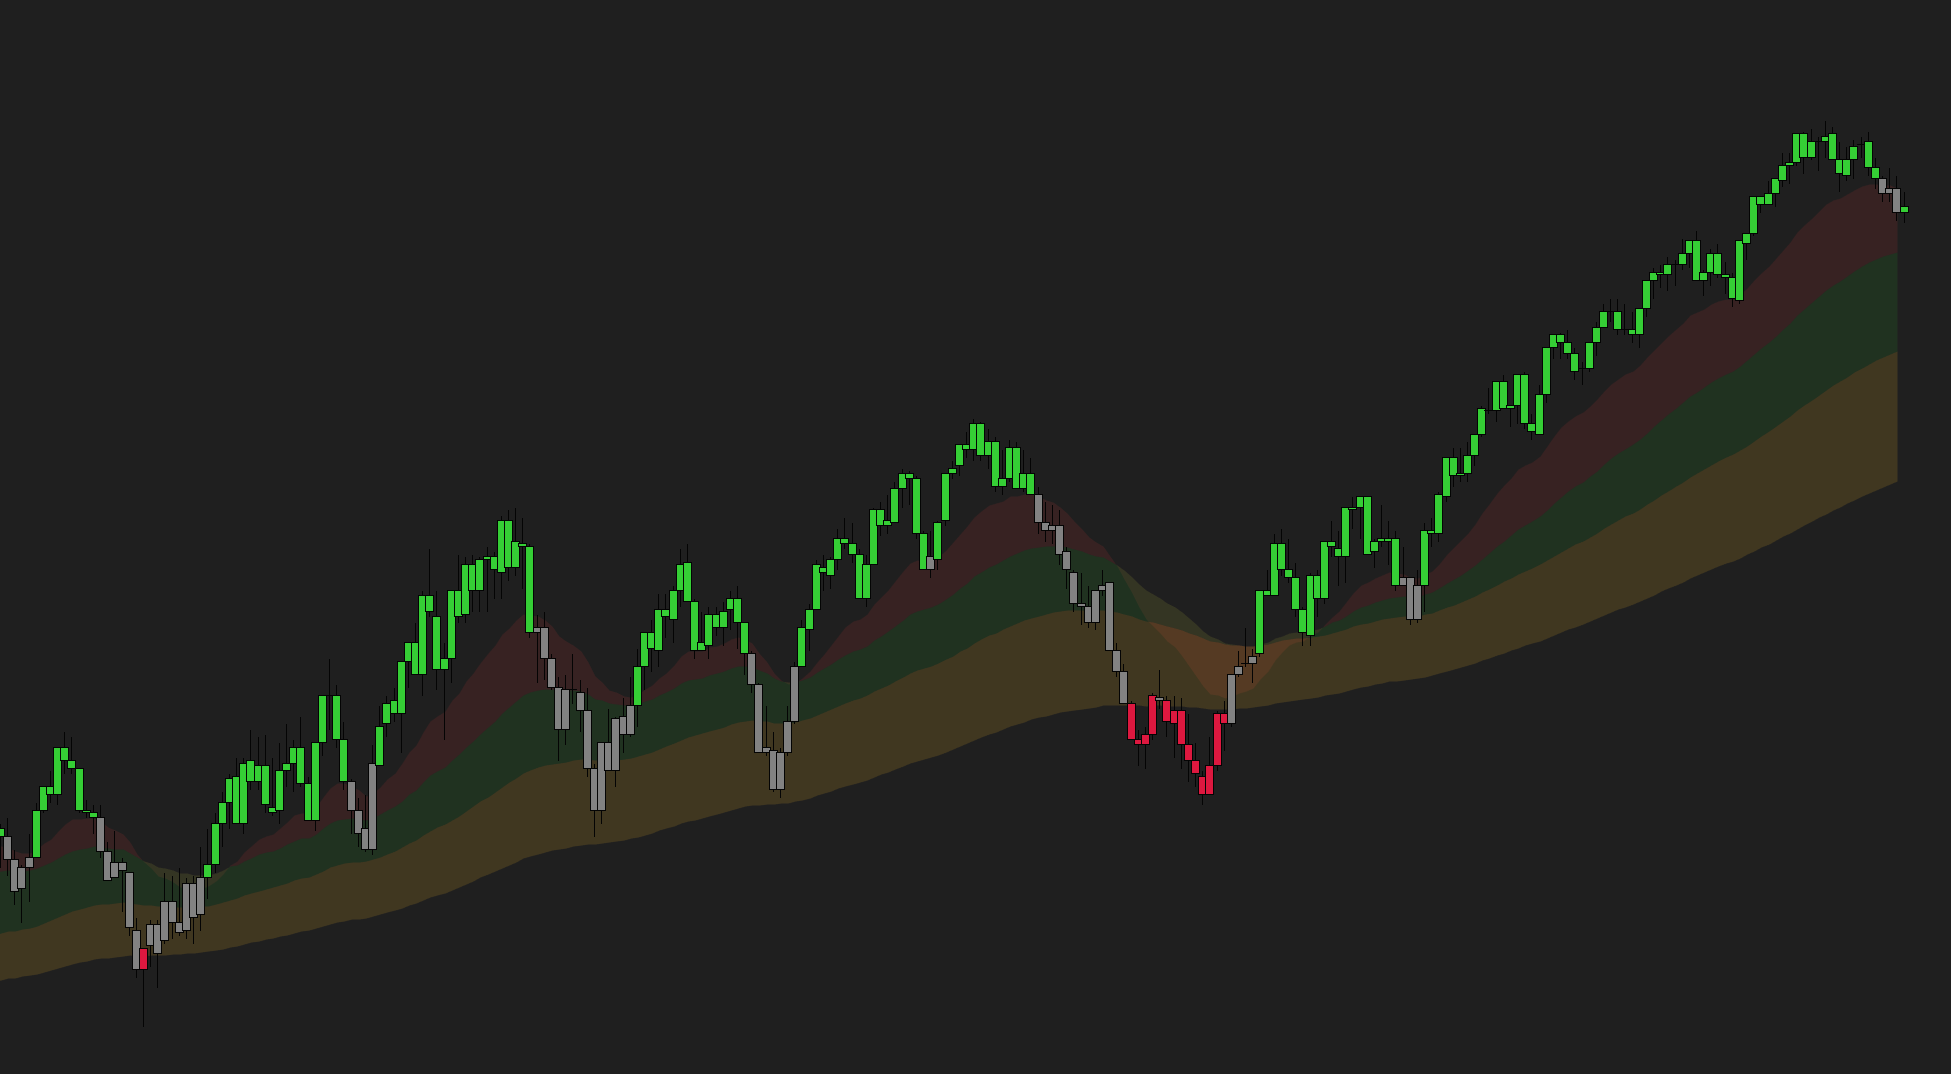
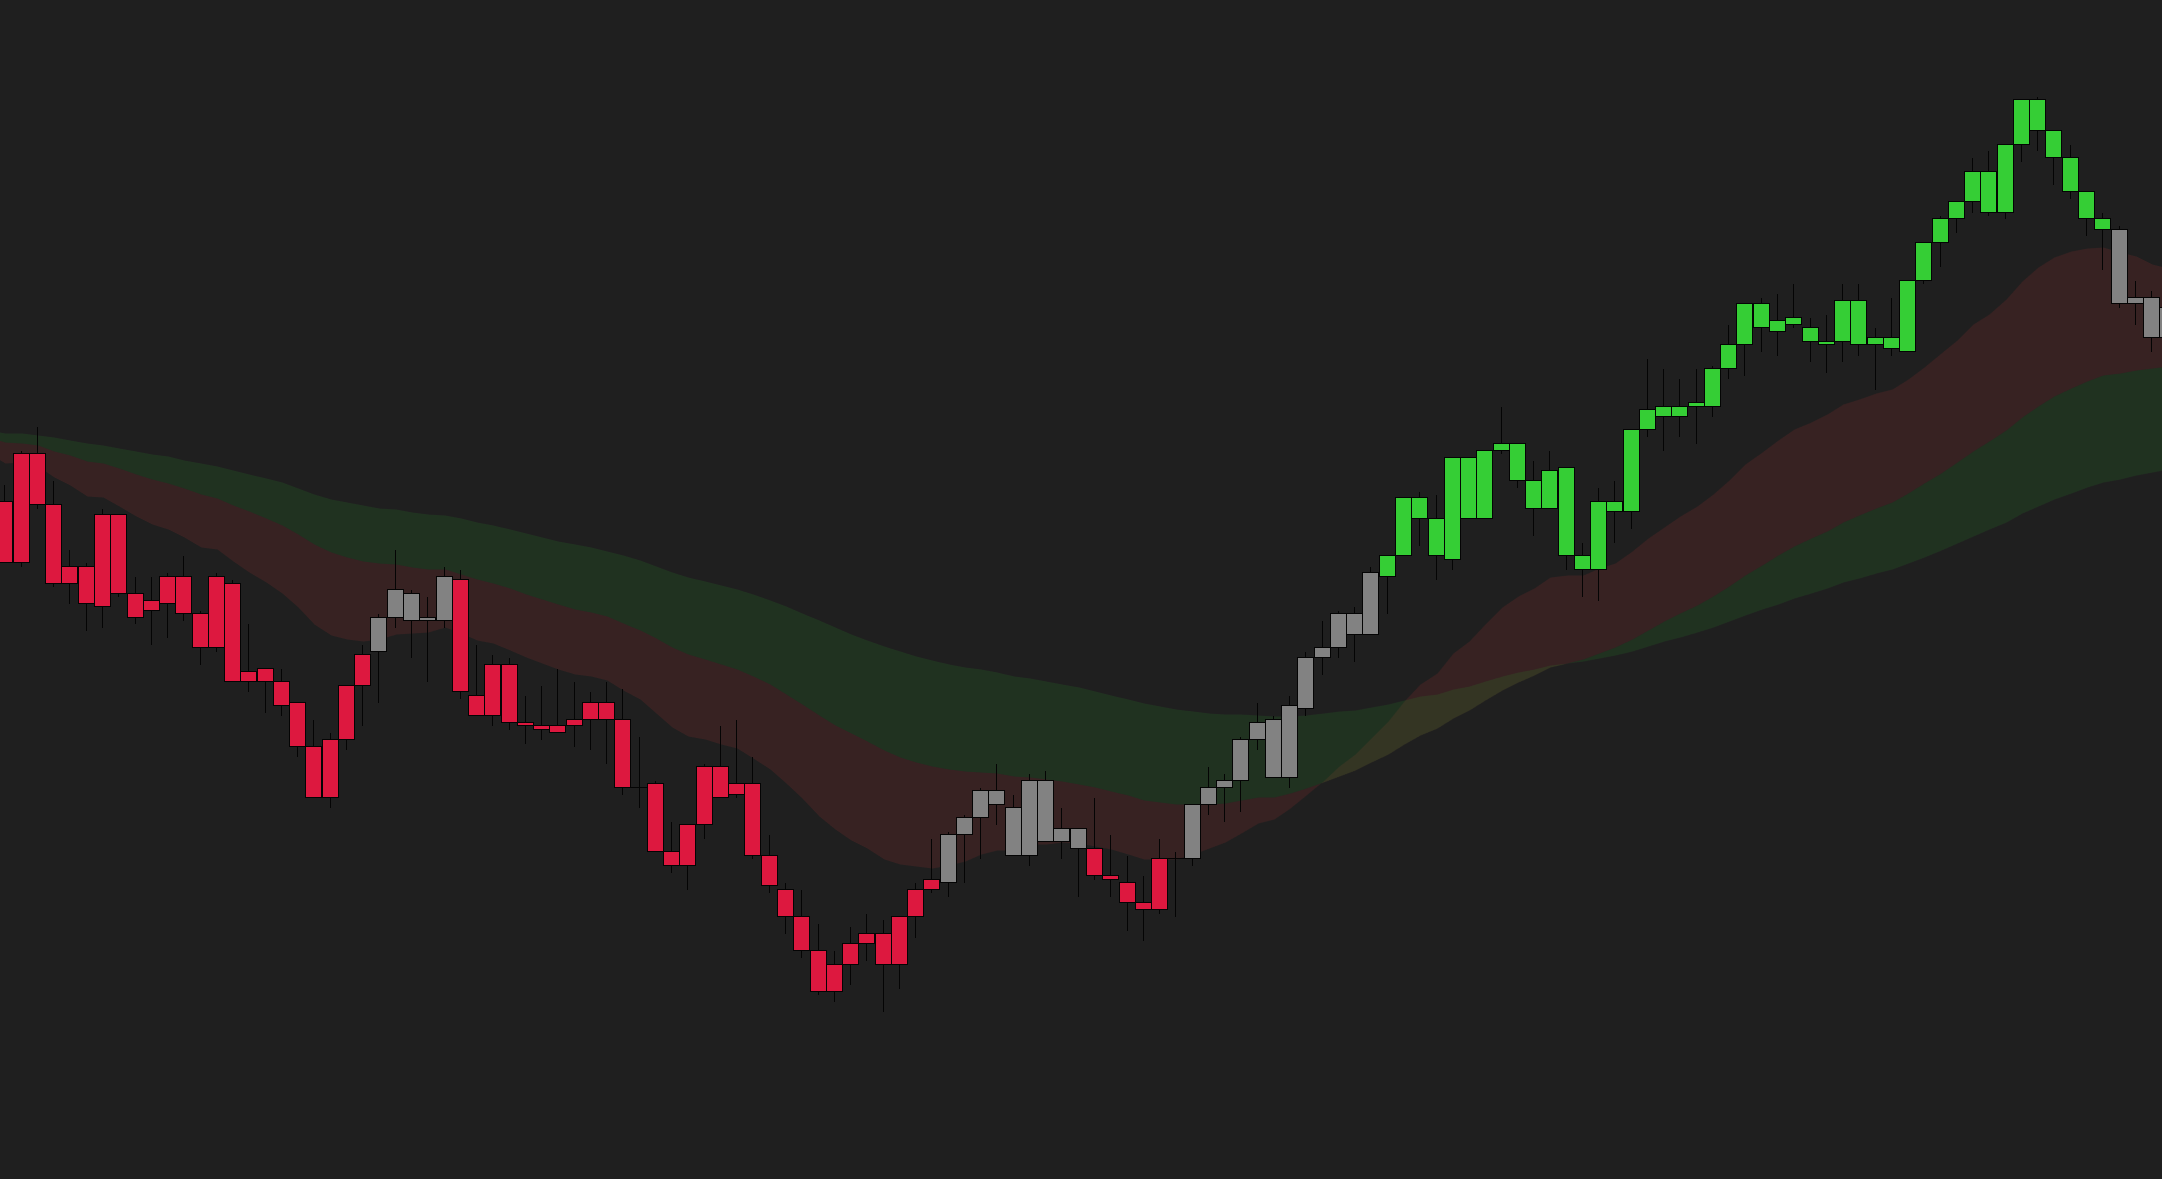
The shape tells you the rest: zones fanning out means momentum is strong and one-directional; a pinch into the neutral band means the trend is stalling — often right before a reversal or a breakout. And with paint bars on, the candles themselves say it too: bullish, bearish or neutral at a glance.
We wanted a color-zone indicator that truly does it all: accurate zones plotted between exactly the values you want, every color and opacity setting yours to change, readable in a half-second glance — and working the same on any chart type, tick to Renko, on any instrument.
It won't pick your trades — no indicator will. What it does is make the trend impossible to misread. No repaint, free, lean, no bloat, no upsell — built by a working futures trader.
Before any entry, one half-second glance: are the zones stacked in your direction? Trading with the stack is trading with the averages — against it, you'd better have a reason.
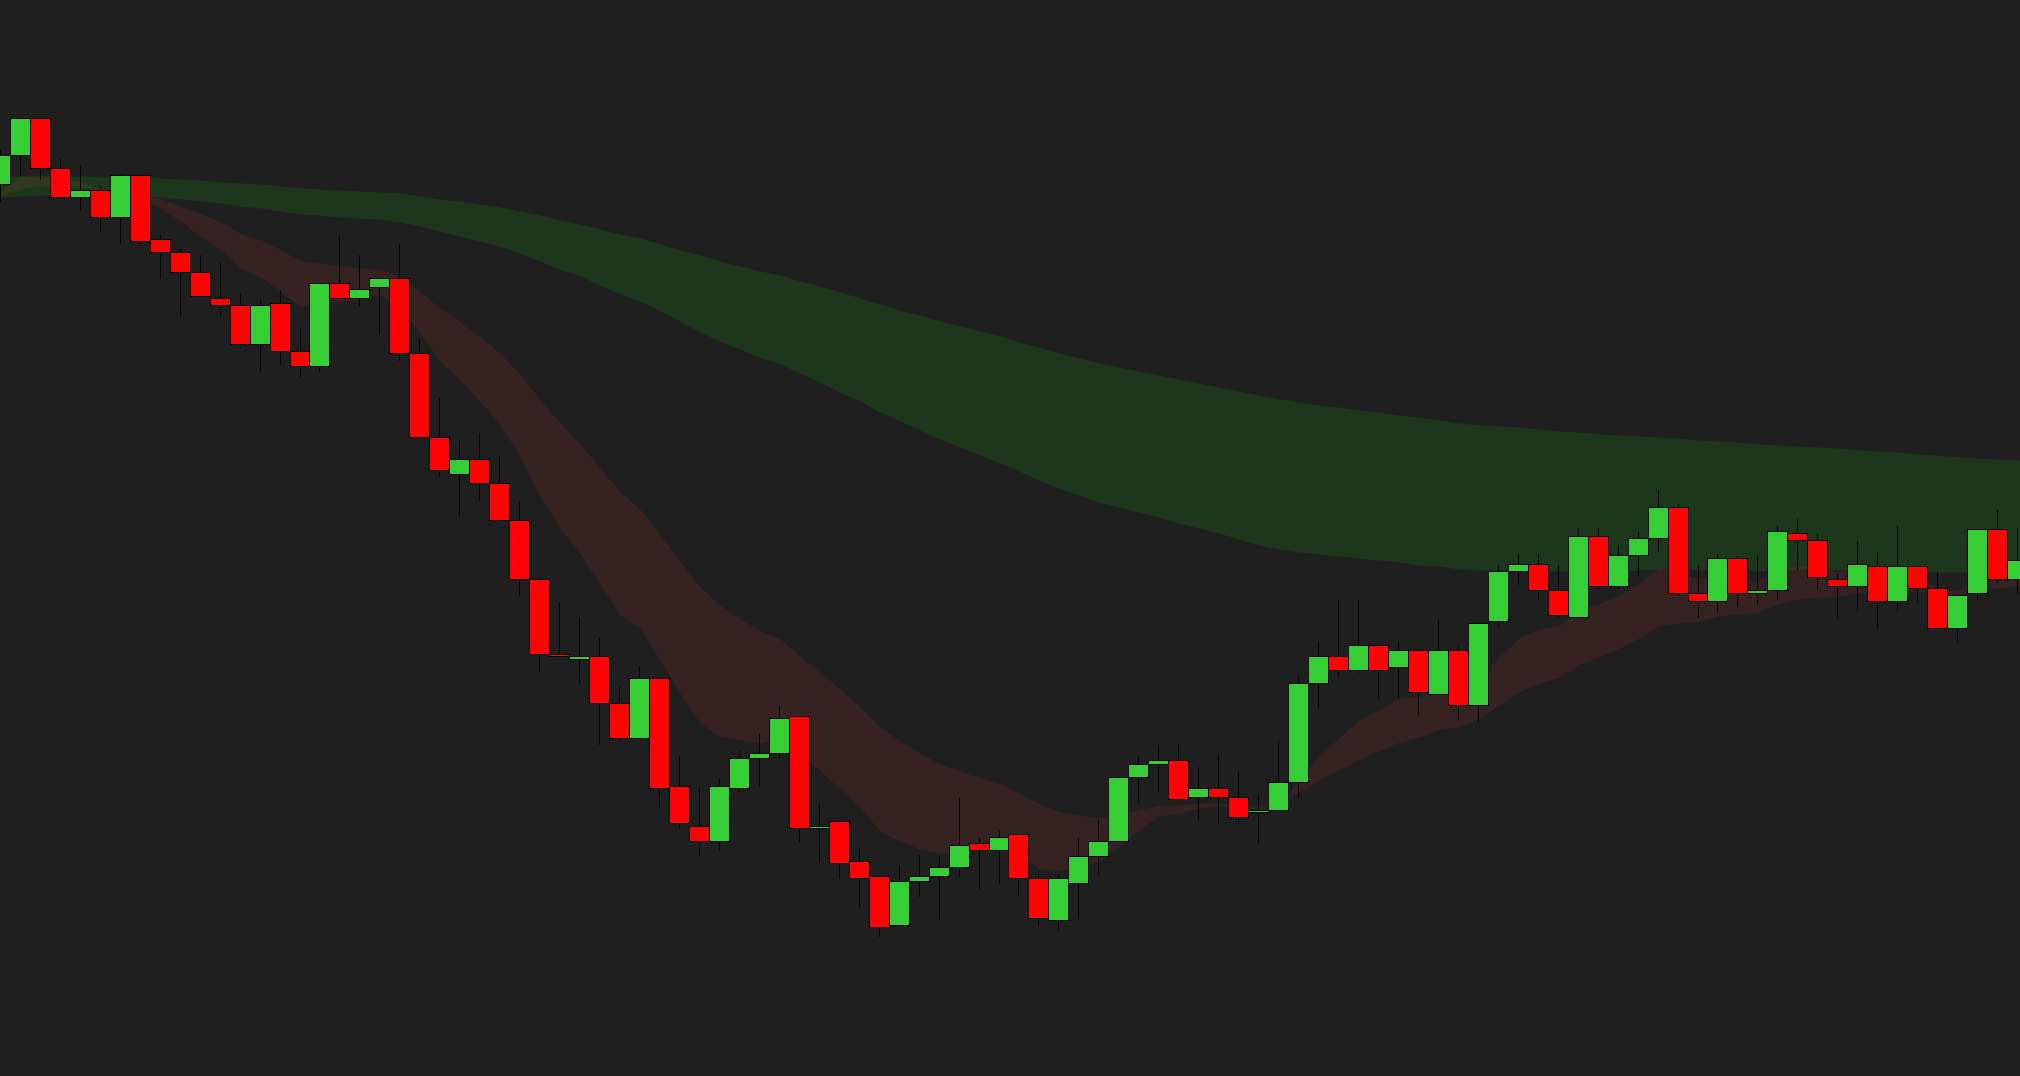
Price dips into the zones and holds — the market catching its breath, not turning. A clean visual for buying strength in an uptrend or fading weakness in a downtrend.
Zones pinch into a flat neutral band — the averages are converging and the trend is stalling. Expect chop or a break; stand down until the zones fan out again.
Turn on paint bars and let the candle colors do the filtering: full color above or below all the averages, neutral in no-man's land. Only trade when the bars agree with you.
None of these are trade signals — they're ways to read one honest picture of the trend. The entries, the stops and the discipline are still yours.
New to EMA clouds? Read our full guide — How to add an EMA cloud (moving average ribbon) →
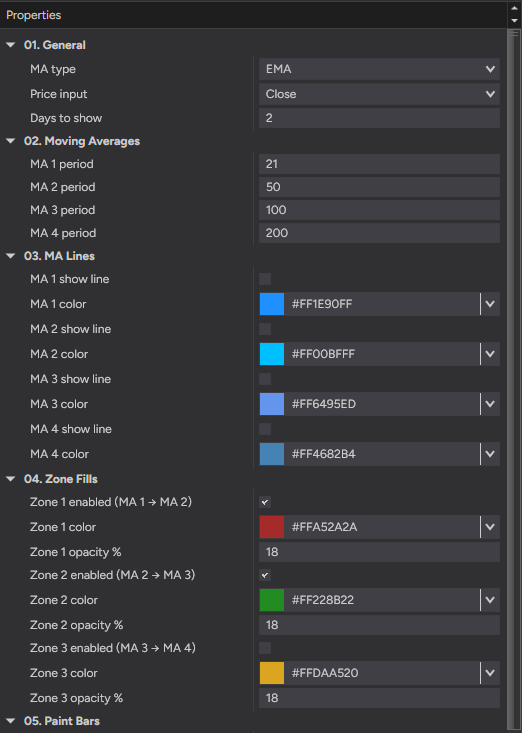
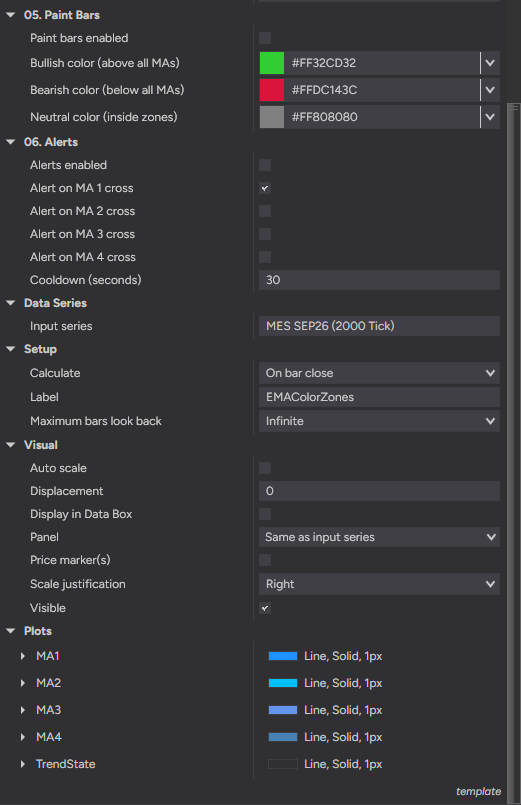
EMA Color Zones is built to be set up once and left alone. Every moving average, color, zone and paint setting is yours to control — nothing is hard-coded. Below is the actual settings panel: numbered groups, plain-English names, no cryptic abbreviations.
After checkout, download the EMA Color Zones .zip — it's on the confirmation page, and in your email receipt.
In NinjaTrader 8: Tools → Import → NinjaScript Add-On, then select the .zip.
Right-click any chart → Indicators, add EMA Color Zones, and set your MA periods and colors.
- File
- EMAColorZones_v1.0.zip
- Size
- 183 KB — lean, no bloat
- Format
- NinjaScript add-on (.zip import)
- Delivery
- Instant — checkout page + email
NinjaTrader 8 (latest version recommended)
Any instrument — no volume data required
Every chart type: tick, minute, volume, range and Renko
Any data provider — Rithmic, Kinetick, and more
Free forever — no catch, no upsell
Free updates — always current
Step-by-step installation guide
Email support from a working trader
Most traders are up and running in under a minute. Stuck on anything? Email us — we're traders too, and we answer.
EMA Color Zones on a live chart — the trend zones, paint bars and MA crosses in action.
Complete your setup
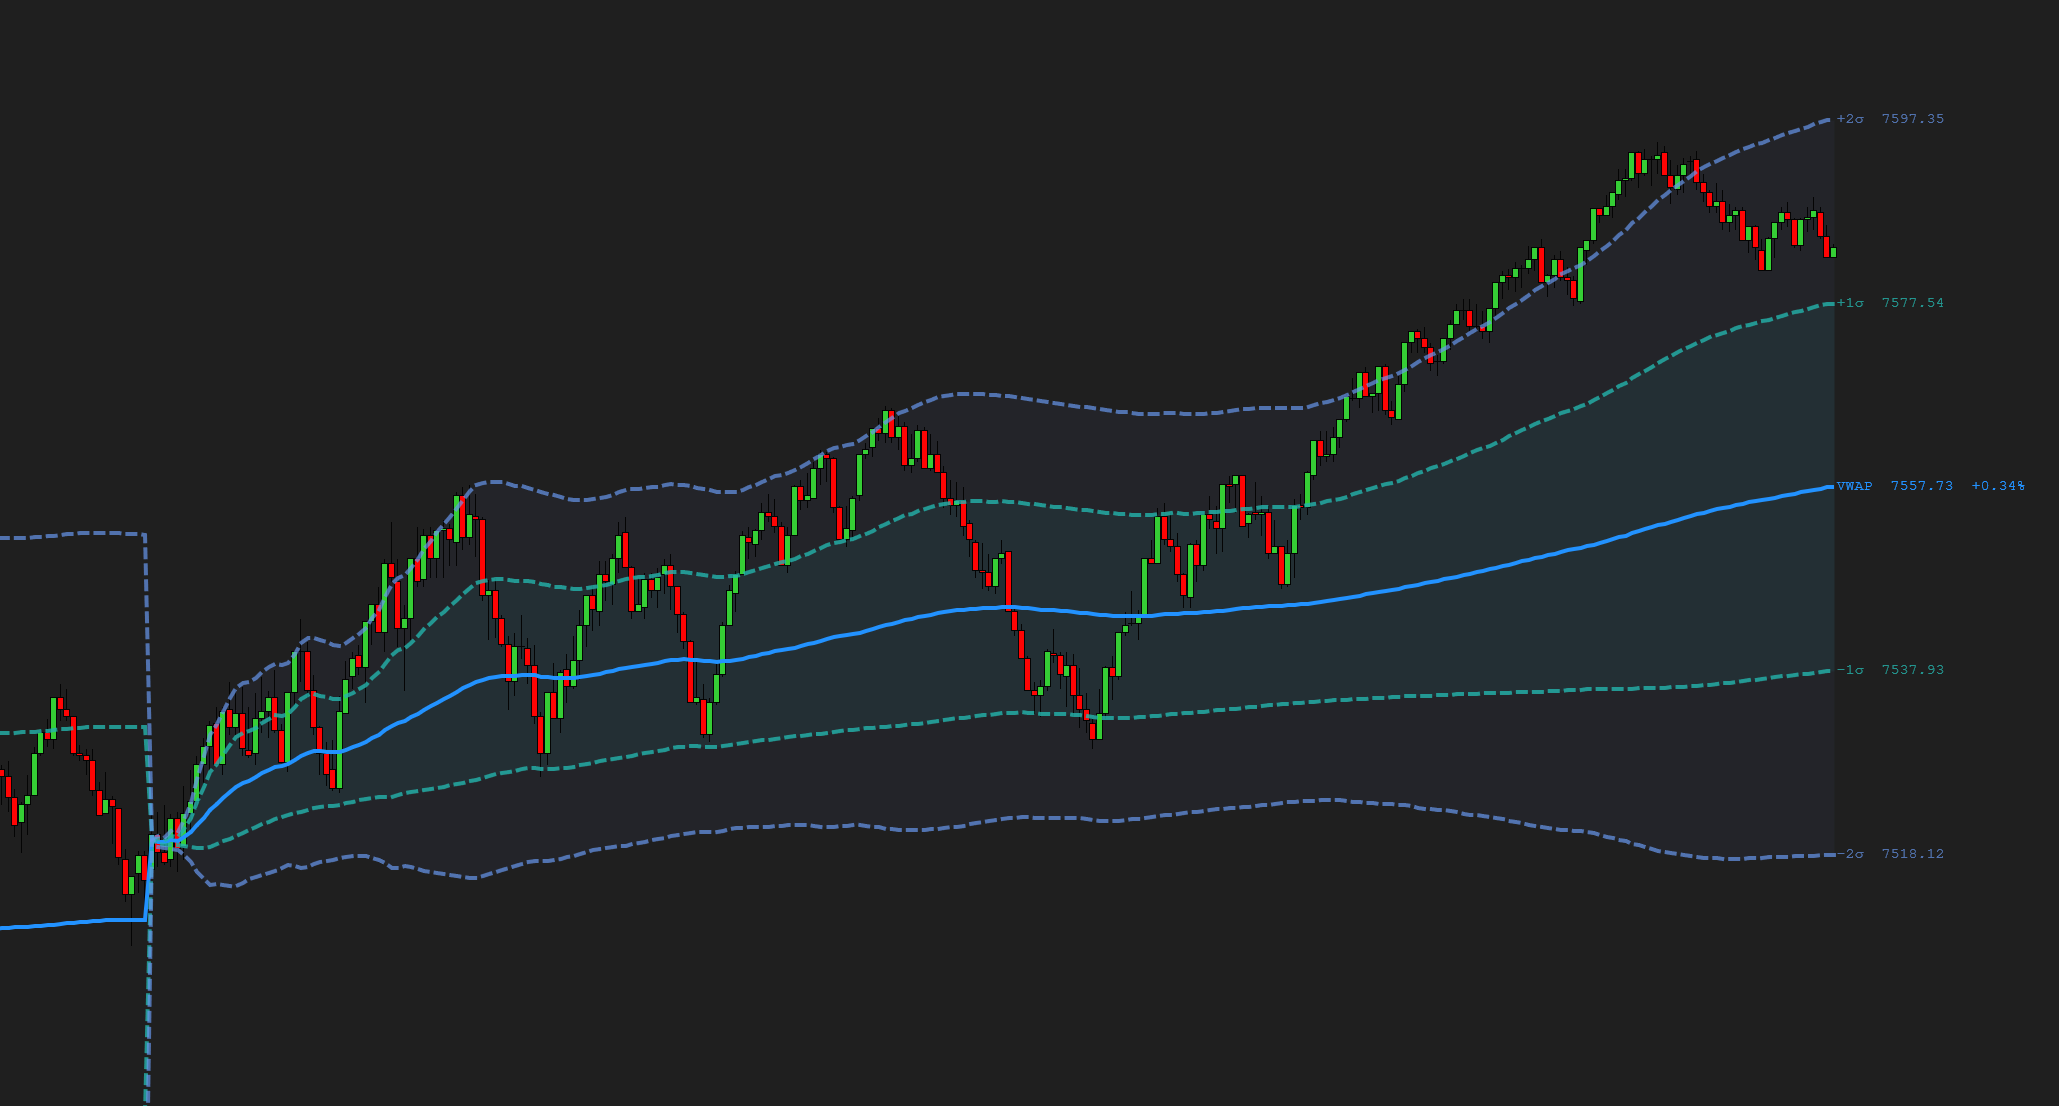
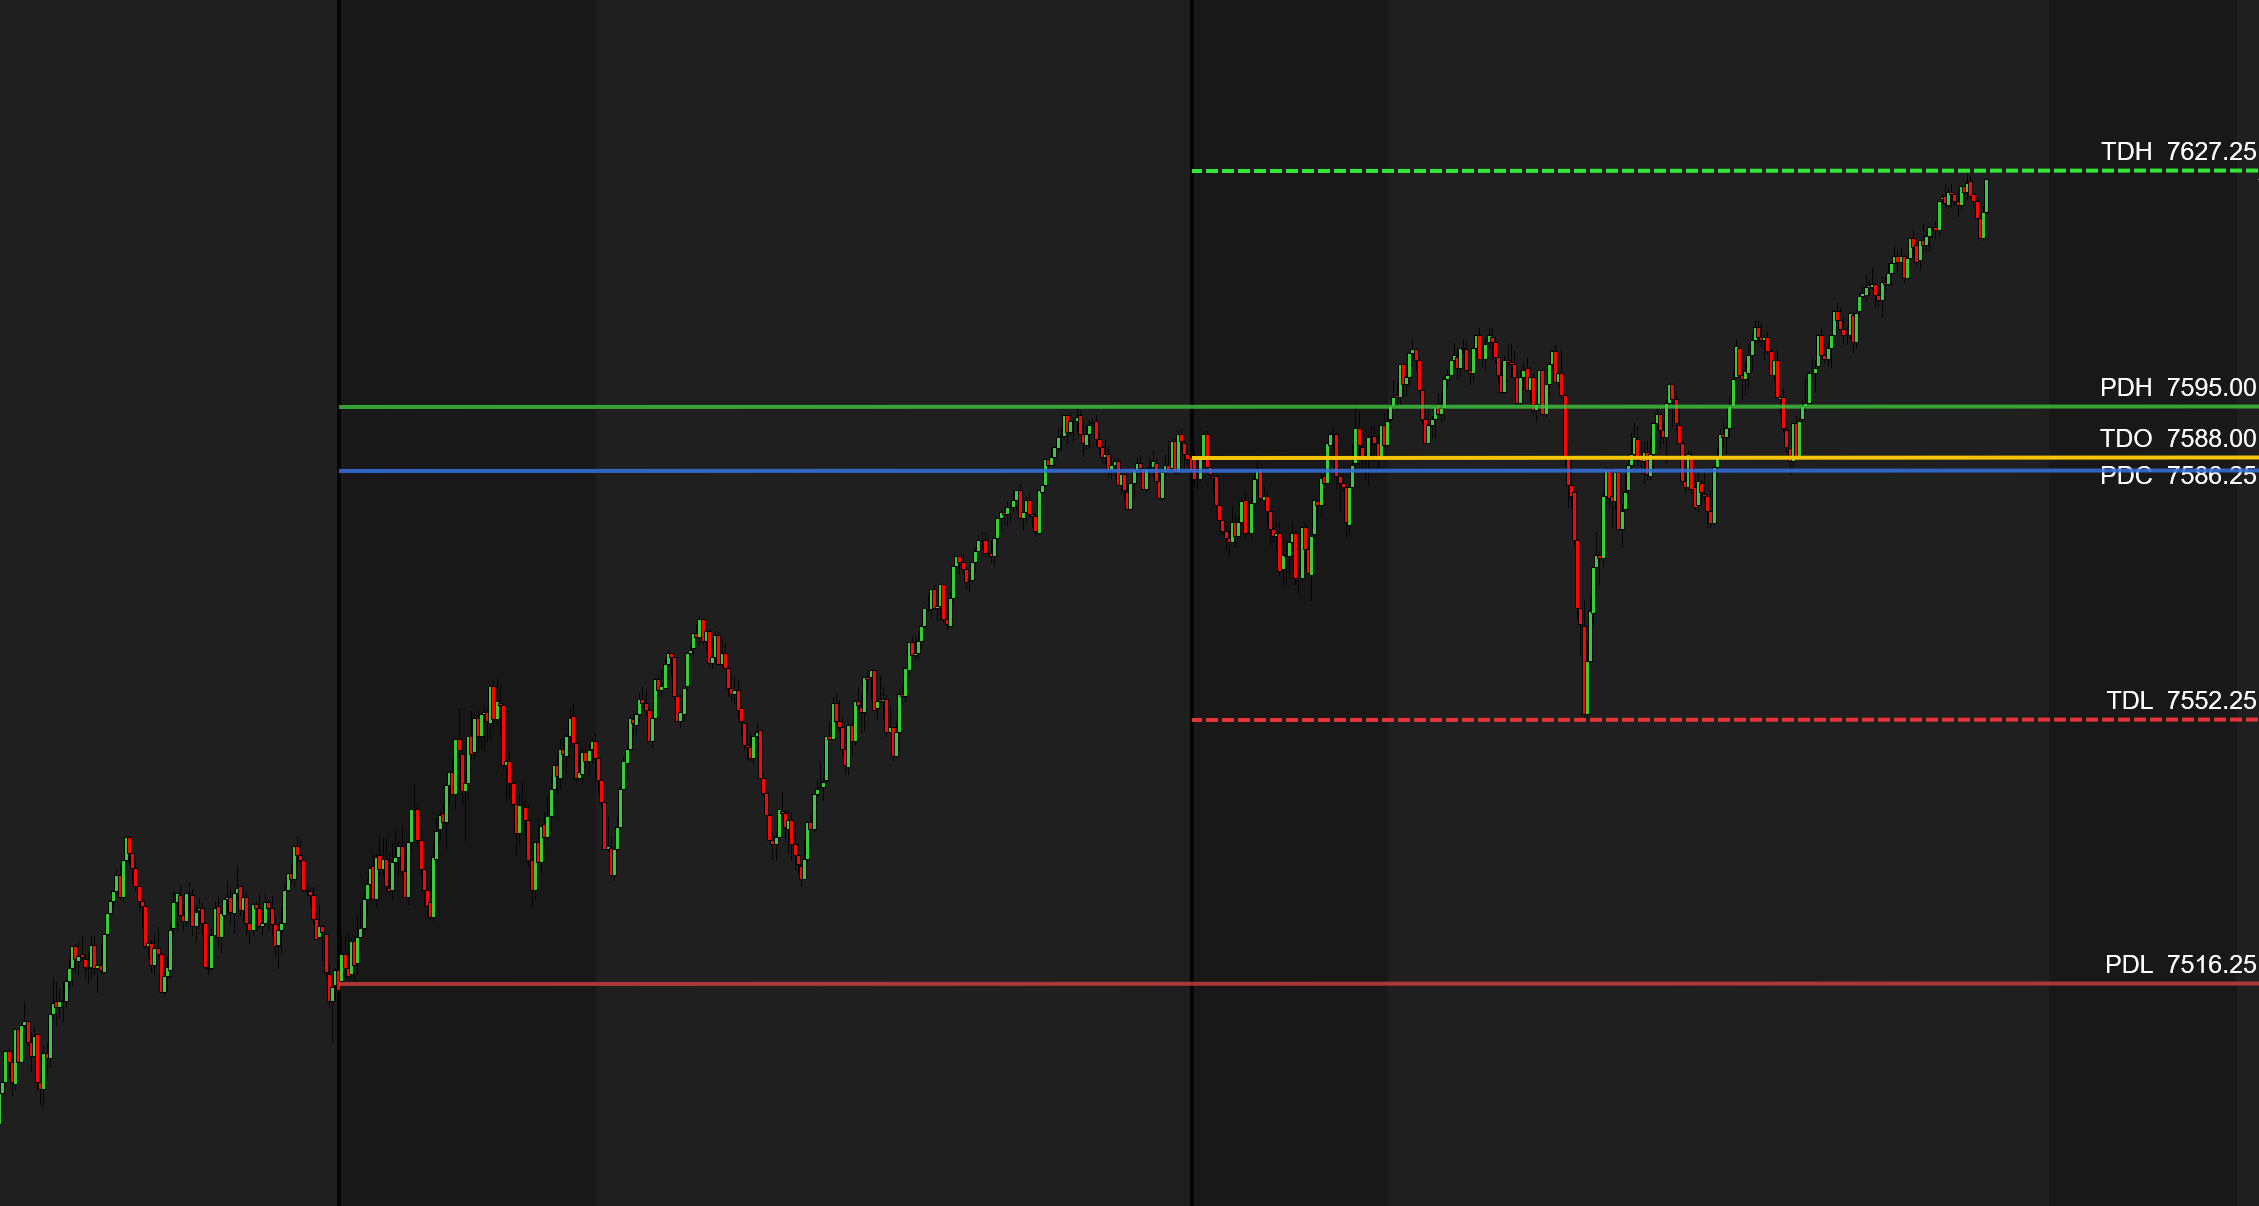
Color-filled trend zones across four moving averages — free, no repaint, and built by a working futures trader.
Futures trading involves substantial risk of loss and is not suitable for every investor. EMA Color Zones is a charting and decision-support tool only — it is not a trade signal, recommendation, or financial advice. Past performance is not indicative of future results.