Does NinjaTrader 8 Have a Risk Reward Tool? Yes, and It Is Free
Almost every trader who goes looking for a NinjaTrader risk reward tool already has one and does not know it. Here is where the free built-in tool lives, the one setting that makes it genuinely useful, what the paid add-ons do on top, and the thing none of them show you.
Does NinjaTrader 8 have a risk reward tool?
Yes. One ships with the platform, it costs nothing, and it is the single most common thing traders go shopping for without checking whether they already own it. So if the question is simply does NinjaTrader have a risk reward tool, the answer is yes, and it is the one to try first.
NinjaTrader’s own one-line description of it is “automatically calculate your target based off a user defined stop loss”, which is a fair summary: you tell it where the stop goes, and it puts the target where your ratio says it should be.
Where to find it, in four clicks
- Right-click anywhere on the chart.
- Choose Drawing Tools.
- Choose Risk Reward from the list.
- Click three times on the chart — once for the entry, once for the stop, once for the target.
That is the whole installation, because there is none. If you want it on every chart and every workspace, NinjaTrader has a Global drawing objects across workspaces option that will carry it across; the chart’s right-click menu also has Hide drawing objects and Remove drawing objects for when the chart gets busy.
How the built-in tool actually works
It has three anchors, and NinjaTrader names them plainly in the properties dialog:
- Entry anchor — where you intend to get in
- Risk anchor — where your stop would sit
- Reward anchor — where your target would sit
It draws five lines: the entry, the stop and the target, each in its own colour, plus two thin grey connectors running from the entry to the other two. There is no shaded zone and no filled box — it is lines and a number, which is why it sits quietly on a busy chart rather than burying it.
The part most people miss is that the target is derived, not placed. The Ratio setting is the risk reward ratio, and it defaults to 2, so once you have set the stop the target lands at twice that distance by itself. Change the ratio to 1.5 or 3 and the target moves on its own. That makes it quick to ask “if my stop has to go below that swing low, where does a 2R target actually land?” before you commit to anything — and to see immediately that the answer is somewhere nobody is going to trade.
Out of the box each line is labelled with its price. The ratio itself is never drawn on the chart; it is a number you type into the settings, not something the tool reports back at you.
Every setting, and the one worth changing
There are only seven, and they are worth knowing because one of them changes what the tool is for.
| Setting | Default | What it does |
|---|---|---|
| Ratio | 2 | How far the target sits, as a multiple of the stop distance. Set the stop and the target places itself |
| Y value display unit | Price | What the label on each line says. Switch it to Ticks or Currency and the tool stops telling you prices you already knew and starts telling you what the trade is worth |
| Text alignment | Inside left | Where those labels sit — inside or at the chart edge, left or right. Off removes them entirely |
| Extend lines left | Off | Runs the three lines back across the chart, so the levels stay visible after price moves away from where you drew them |
| Extend lines right | Off | The same, forward — usually the one you want, since the trade has not happened yet |
| Entry, stop and target strokes | Goldenrod, crimson, sea green | Colour, thickness and dash style of each line, set separately |
| Anchor stroke | Grey, faint | The two thin connectors between the entry and the other anchors |
Y value display unit is the one. Left on its default it labels each line with a price — which you can already read off the axis. Set it to Ticks and the stop line says how many ticks of risk you are taking. Set it to Currency and it says it in dollars. That is the difference between a drawing and a decision, and it is two clicks deep in a settings dialog most people never open.
One honest caveat on Currency mode: the figure is for one contract. The tool has no idea how many you are planning to trade, so if you are sizing three, multiply by three yourself.
The tool is also alert-capable, so a Risk Reward line can be used as the basis of a NinjaTrader alert rather than something you have to sit and watch.
Is there a free risk reward indicator?
Yes — the one above, and it is the one we would start with. It gives you the risk to reward on any setup in three clicks, and it is already installed.
There are also free risk/reward tools on the NinjaTrader Ecosystem, several of them well made and widely downloaded. They are worth a look once you have found the limit of the built-in tool, but not before. A large share of the people who install one are solving a problem that Y value display unit would have solved.
What is not free, anywhere, is the thing in the last three sections of this page: showing you the orders you have actually placed rather than the ones you sketched. That is a different job, and no drawing tool does it.
What the paid add-ons add
There is a healthy market of risk/reward add-ons for NinjaTrader 8. They differ in the details, but the additions are consistent:
- Position sizing. You type a dollar risk, and the tool works out how many contracts that stop distance allows — which is the multiplication the built-in tool leaves to you.
- Multiple targets. Extra levels at 2R, 3R and beyond, drawn as you drag.
- One-click entry. Turn the drawing into a live bracket order without retyping it.
- Break-even and trailing rules applied once the trade is running.
If what you want is to plan a trade before you take it — sizing it correctly, seeing the ratio, comparing two setups — the built-in tool covers the basics and the add-ons cover the rest well. Nothing below is an argument against them.
Where your stop loss actually comes from
To follow the next part it helps to know where NinjaTrader keeps your real risk, because it is not the drawing. If you want the full version, we have a separate guide on how ATM strategies work and the two settings that catch people out.
ATM stands for Advanced Trade Management — NinjaTrader’s own name for it. An ATM strategy is one of your saved templates, picked in the Chart Trader panel before you place an entry. When that entry goes in, NinjaTrader automatically creates the exit orders behind it: a stop loss and a profit target. You do not place them by hand, and that is the point — the protection exists from the moment the entry fills.
The template stores how far those exits sit, and NinjaTrader lets you express that distance as one of five types:
- Ticks — a distance from your entry, in ticks
- Pips — the same idea, in pips
- Percent — a share of the entry price
- Currency — a money amount for the whole bracket, not per contract
- Price — the actual price level, not a distance
That last one catches people out. Type 10 into a Price-mode stop expecting ten ticks and you have asked for a stop at the price 10.00; the exchange rejects it and the position ends up with no protection. It is worth knowing which mode your template is in before you rely on it.
One more thing to know: the Chart Trader panel has to be open on that chart. It is where the ATM dropdown lives, where the account is chosen, and where the quantity comes from. Collapsed is fine — it just has to be there.
What none of them show you
Here is the part worth being clear about, because it took us a while to see it ourselves.
A risk/reward drawing is a hypothetical. It is a shape you placed on the chart. It looks exactly the same whether or not you have an order working, and it does not change when your actual orders do.
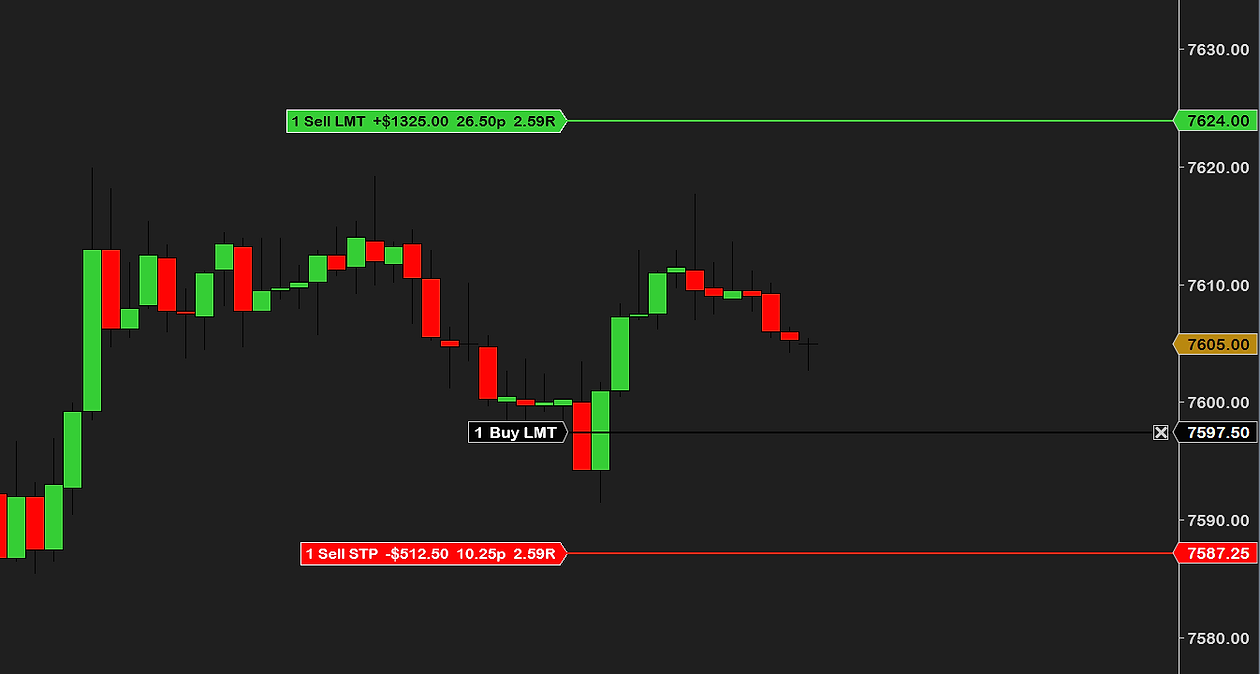
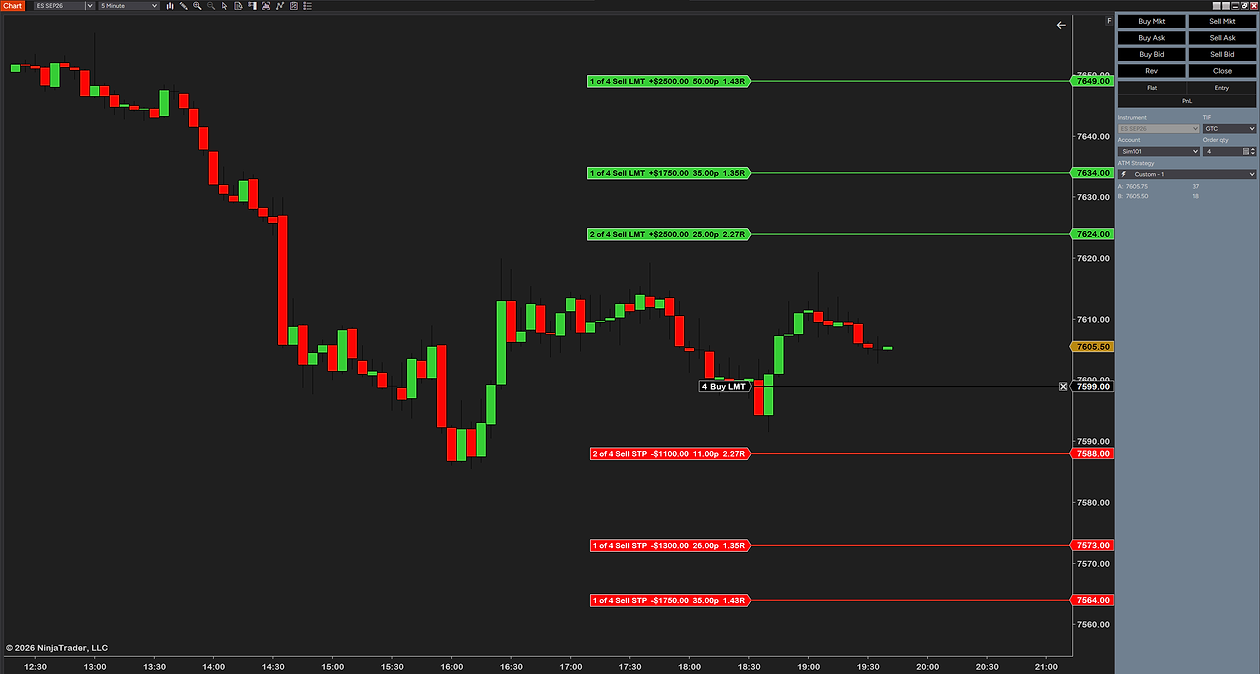
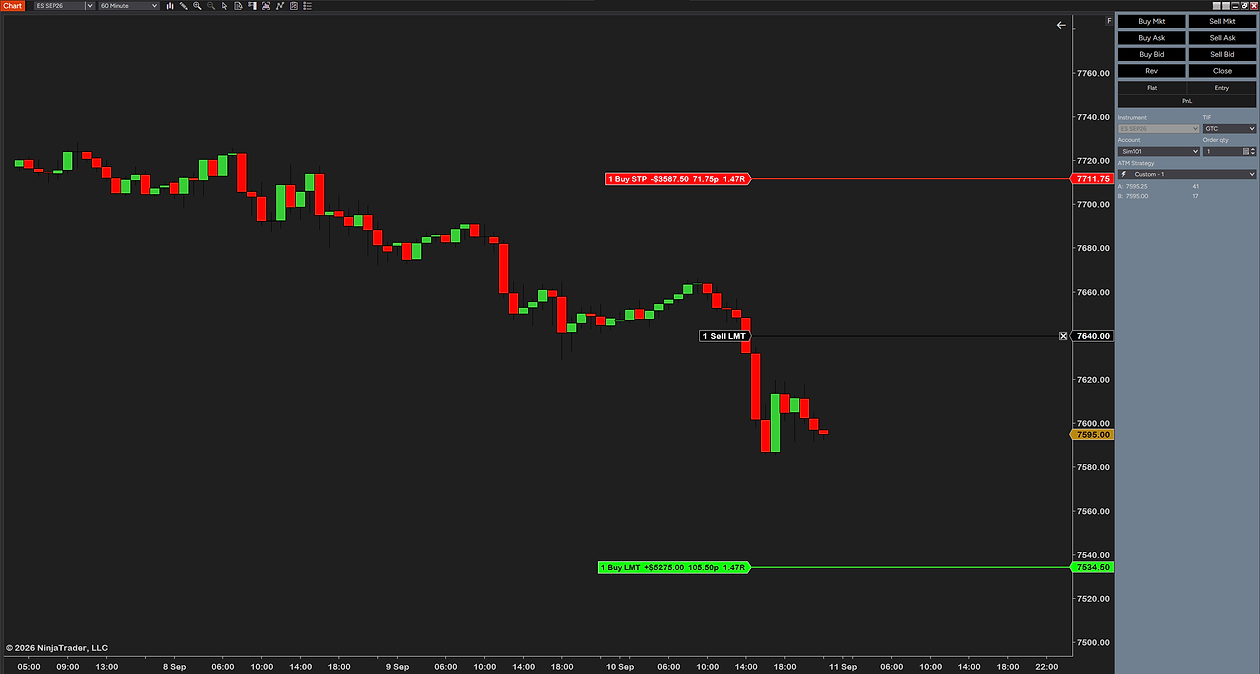
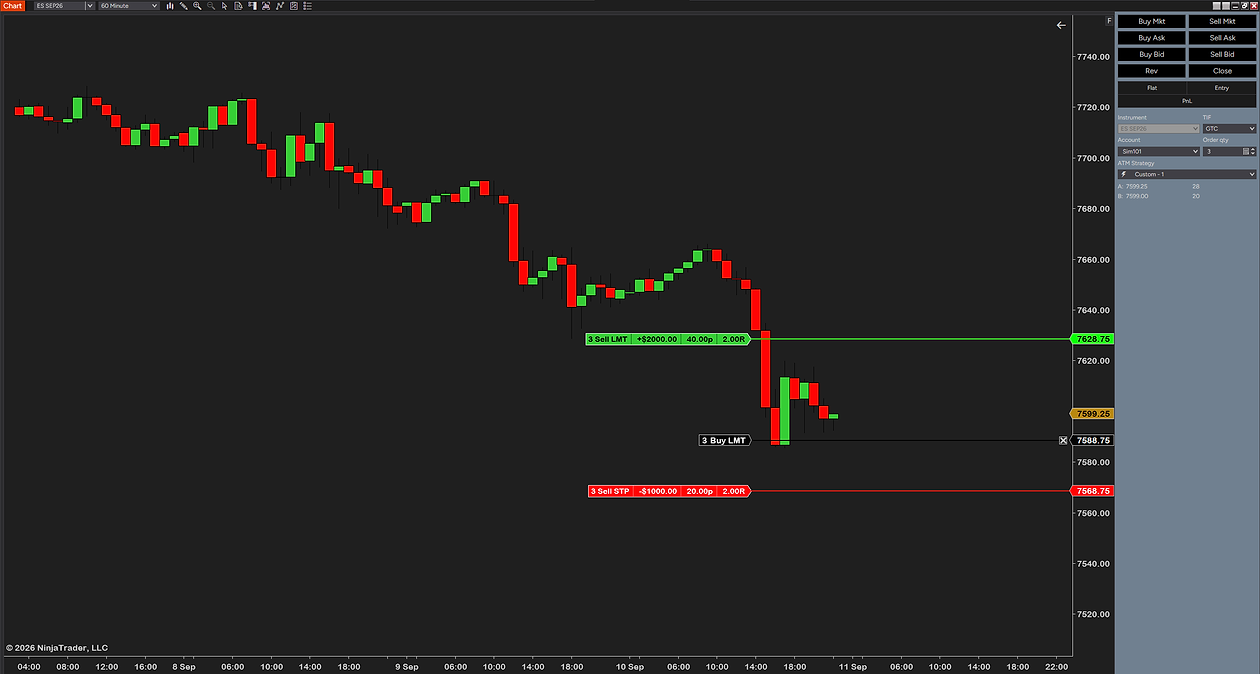
Your ATM bracket is not. The stop loss and profit target sitting behind your entry are what you are actually risking — and until that entry fills, NinjaTrader draws nothing for them on the chart at all.
So there is a window — between placing a resting limit order and it filling — where your plan is on the chart as a set of lines, your real bracket is invisible, and the two are not necessarily the same thing. If your ATM template says 12 ticks and your drawing says 15, the chart shows 15 and the exchange holds 12.
Seeing your real stop and target before the fill
This is the problem our ATM risk reward tool exists to solve, and it is a different job from the tools above.
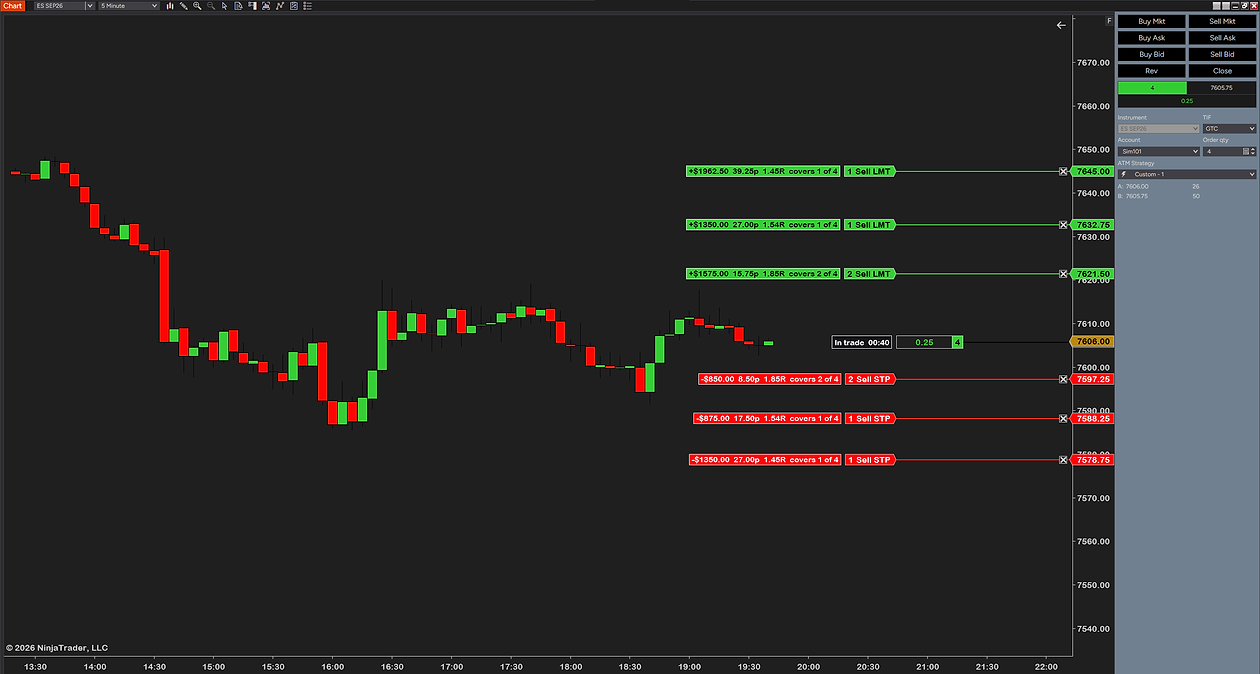
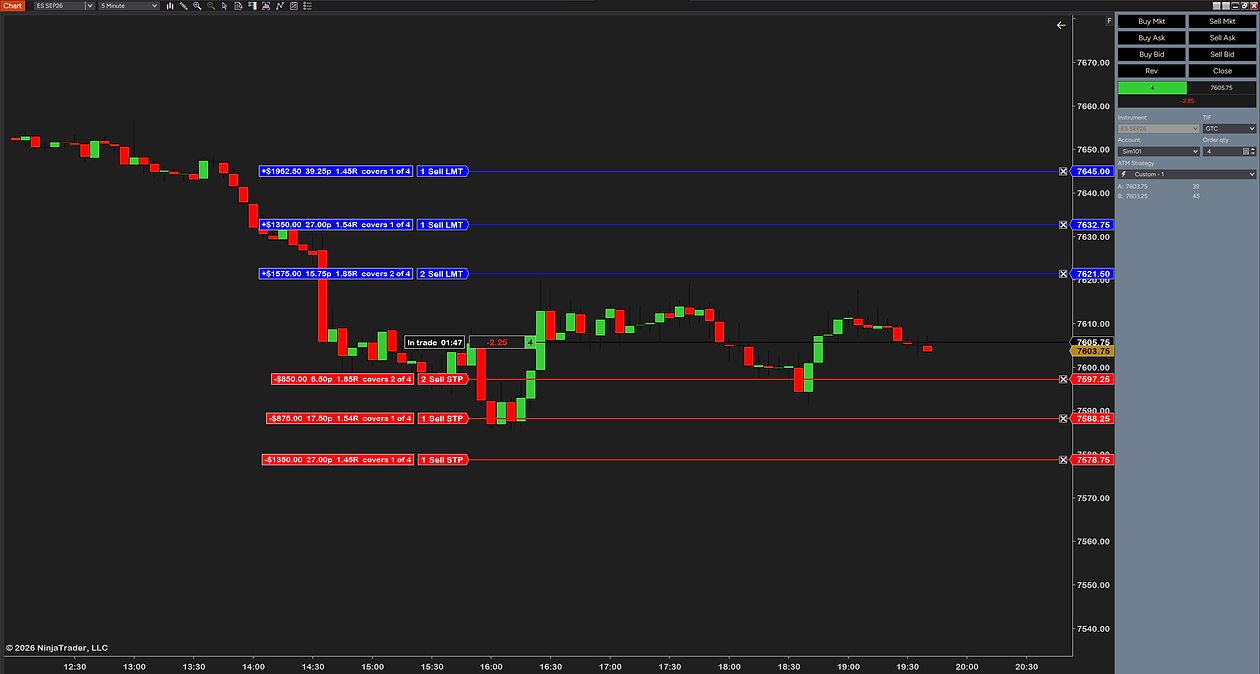
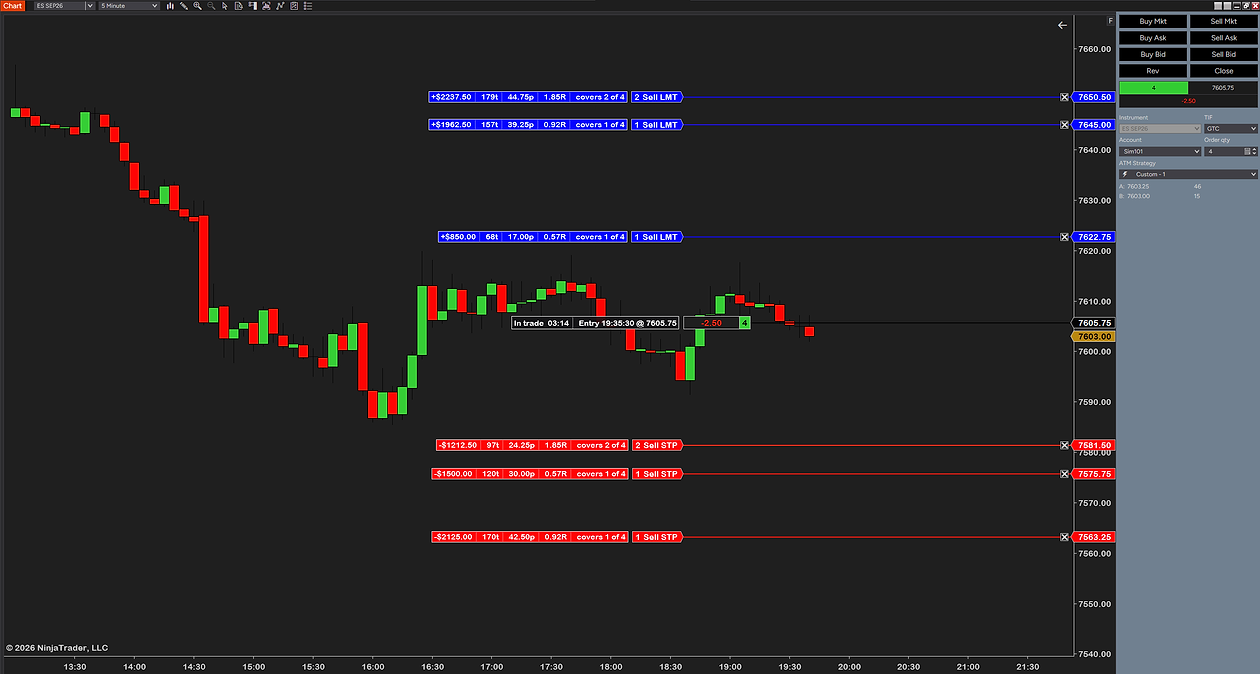
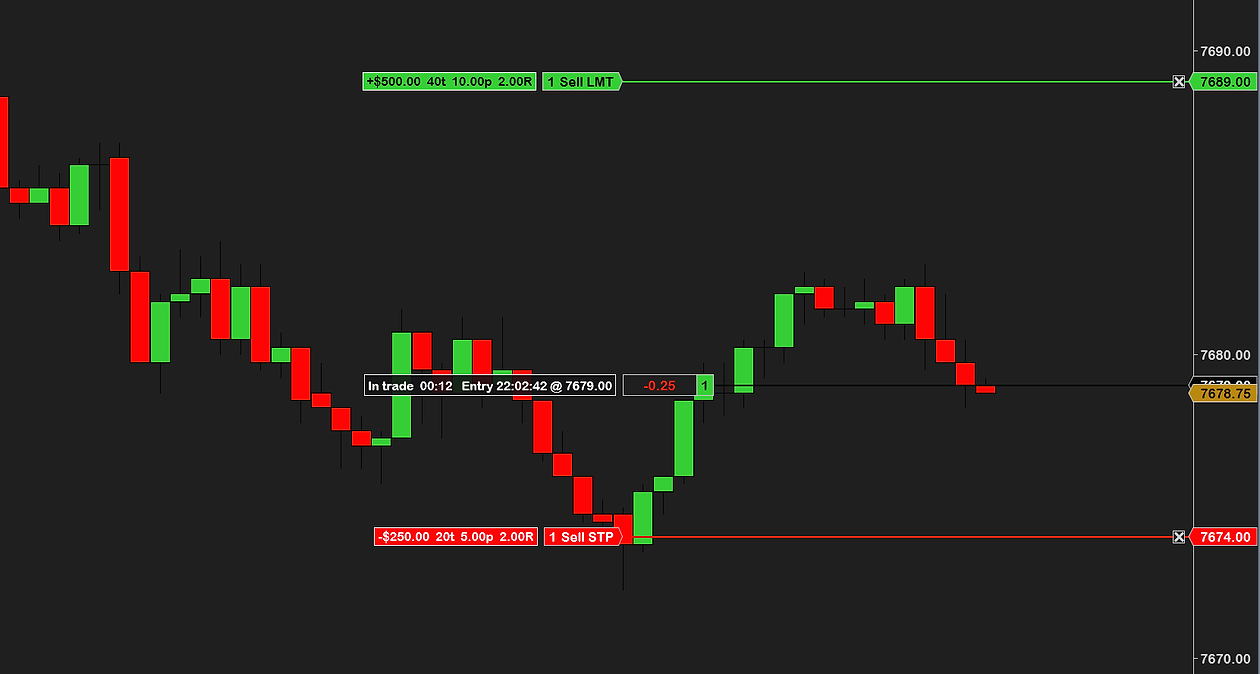
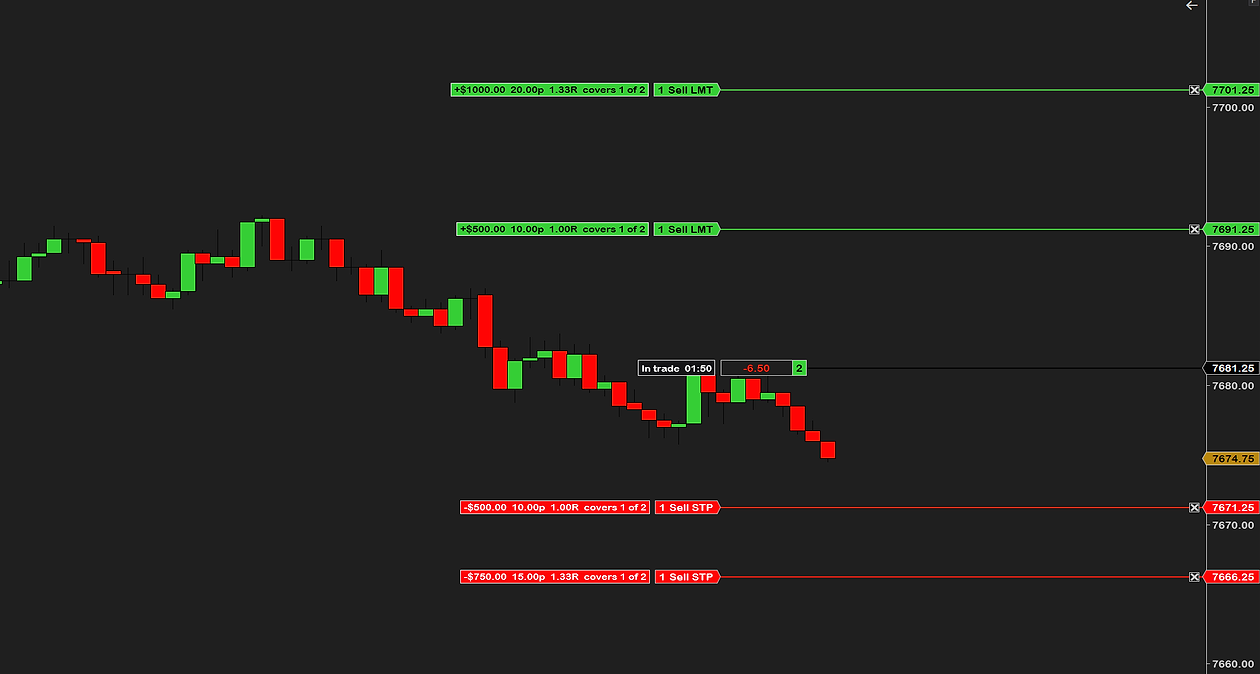
While your entry is still resting, it reads the ATM bracket attached to it and draws the stop loss and profit target order lines on the chart, each tagged with what it is worth: dollars, ticks, points and R. It works from the orders you have actually placed — not a plan, the orders themselves, quantity included. Moving the stop loss is the same gesture you already use: drag one of those lines and the real order moves with it, because it writes the change back into your live ATM strategy.
After the fill it stops drawing lines, because NinjaTrader draws its own, and keeps the numbers beside them, re-based on the price you actually got.
It never places an entry, never cancels anything, and never picks an account. Chart Trader stays in charge; this reads it and shows you what it holds.
Which one do you actually need?
- Planning setups before you commit — the built-in Risk Reward drawing tool, with Y value display unit set to Ticks. It is free and already installed.
- Sizing positions from a dollar risk, or placing brackets in one click — one of the third-party drawing tools.
- Seeing and adjusting the real bracket you have already placed — that is the gap, and it is what our ATM risk reward tool was built for.
They are not competitors so much as different stages of the same trade. Plenty of traders use a drawing tool to decide and something like ours to manage.
Common questions
Does NinjaTrader 8 have a built-in risk reward tool?
Yes, and it is free. Right-click the chart, choose Drawing Tools, then Risk Reward. NinjaTrader describes it as automatically calculating your target from a stop loss you define. Most traders who go looking for an add-on already have it.
Where is the Risk Reward tool in NinjaTrader 8?
Right-click anywhere on the chart, choose Drawing Tools, then pick Risk Reward from the list. Then click three times on the chart: once for the entry, once for the stop, once for the target. There is nothing to install.
How does the built-in Risk Reward tool work?
It has three anchors — entry, risk and reward. You place the entry and the stop, and it works the target out from the Ratio setting, which defaults to 2. It draws a line for each, plus two faint connectors, and labels each line. Change the ratio and the target moves on its own.
How do I make the Risk Reward tool show ticks or dollars instead of prices?
Change the Y value display unit setting. It defaults to Price, which labels each line with a price you can already read off the axis. Set it to Ticks and the stop line tells you how many ticks of risk you are taking; set it to Currency and it tells you in dollars. The dollar figure is for one contract, so multiply it yourself if you are sizing more.
Does the Risk Reward tool place orders?
No. It is a drawing tool, so it draws a plan. Nothing you place with it reaches your broker, and moving a line does not move an order. Your real stop and target come from the ATM strategy attached to the entry.
What is the difference between the drawing tool and my ATM bracket?
The drawing tool shows a hypothetical trade you sketched. The ATM strategy is what actually creates the stop loss and profit target orders when your entry fills. They are unrelated — the lines on your chart can say one thing while the bracket that will be placed says another.
Can I see my real stop and target before the entry fills?
Not with the built-in tool or with the usual add-ons, because a pending entry has no child orders yet — the bracket does not exist until the fill. Seeing it beforehand means reading the ATM template that will be applied and drawing where those orders will land.
Is there a free NinjaTrader risk reward indicator?
The built-in drawing tool is free and is the sensible place to start. There are also free risk and reward tools on the NinjaTrader Ecosystem, some of them good, but a large share of the people who install one are solving something the Y value display unit setting would have solved.
Related guides
- How ATM strategies work in NinjaTrader 8 — where the stop loss and profit target really come from, and the two settings that catch people out.
- Previous day high, low and the levels traders watch — useful for deciding where a stop has to go in the first place.
- Initial balance trading — another way of picking the levels a bracket gets built around.
The honest part
If you only ever trade market orders, the window described above does not exist for you — the fill is instant and NinjaTrader draws your bracket immediately. Our tool earns its place when you work resting limit orders with an ATM strategy attached, which is where the gap lives.
It also requires Chart Trader open on the chart and an ATM strategy selected when you place the entry. Without those two things there is no bracket to read, and it will tell you so rather than draw something that is not there.
And the built-in drawing tool really is free. If that is all you need, use it and keep your money.