What Is the Initial Balance, and How to Plot It in NinjaTrader 8
The Initial Balance is one of the oldest reference ranges in futures — the high and low of the session’s opening period. Here’s what it is, why it matters, and how to plot it live.
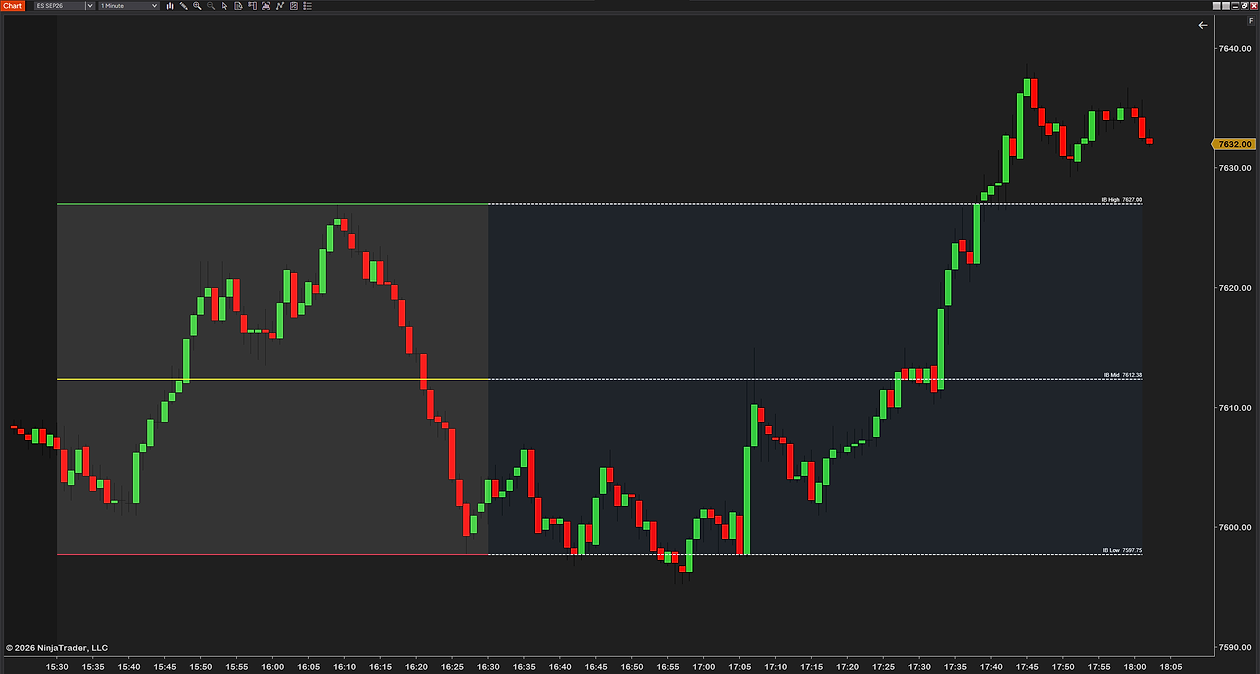
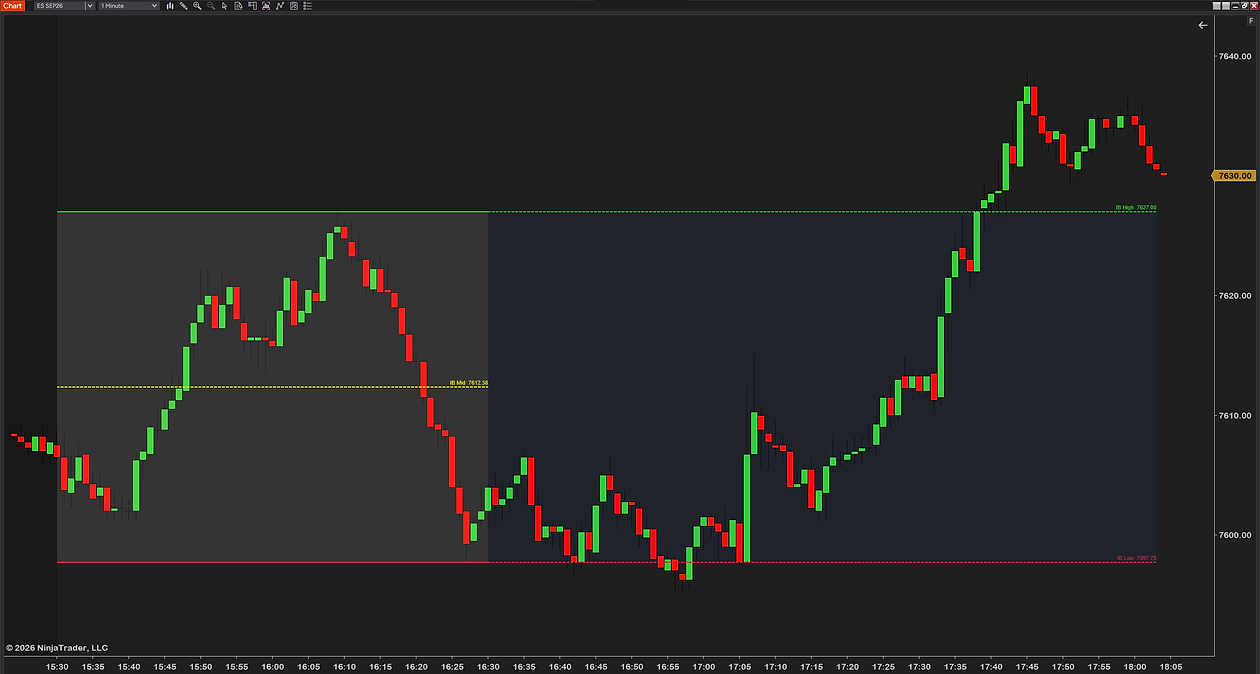
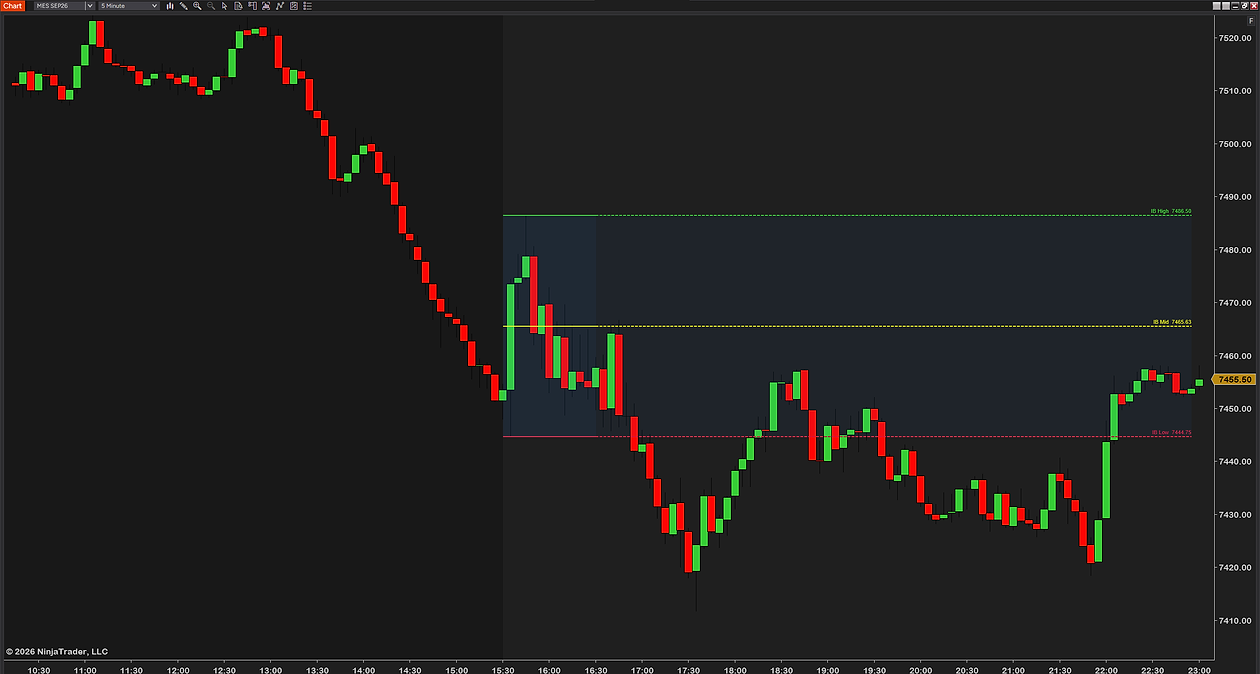
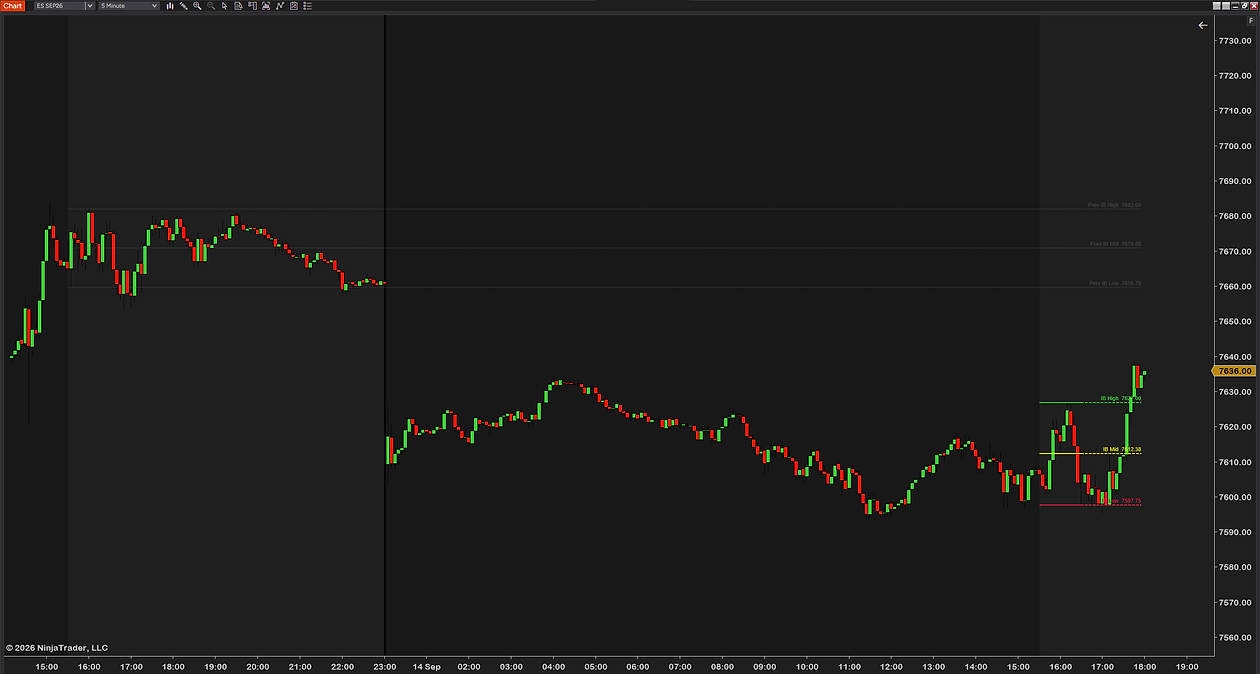
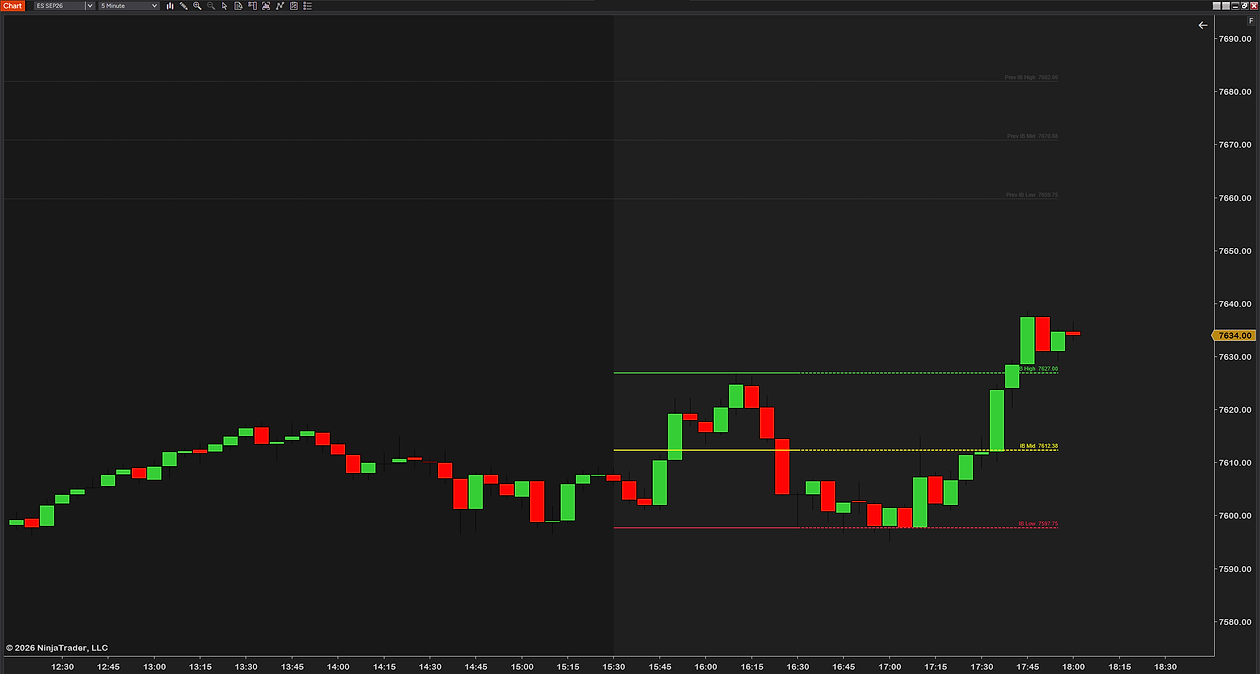
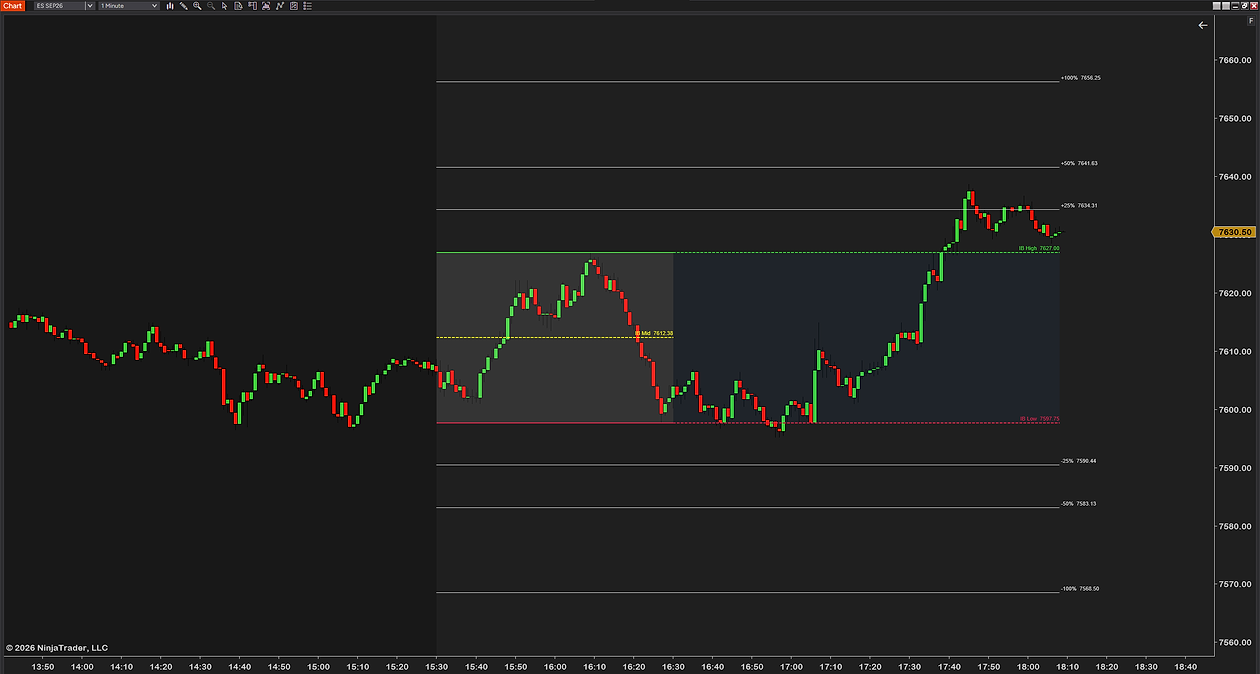
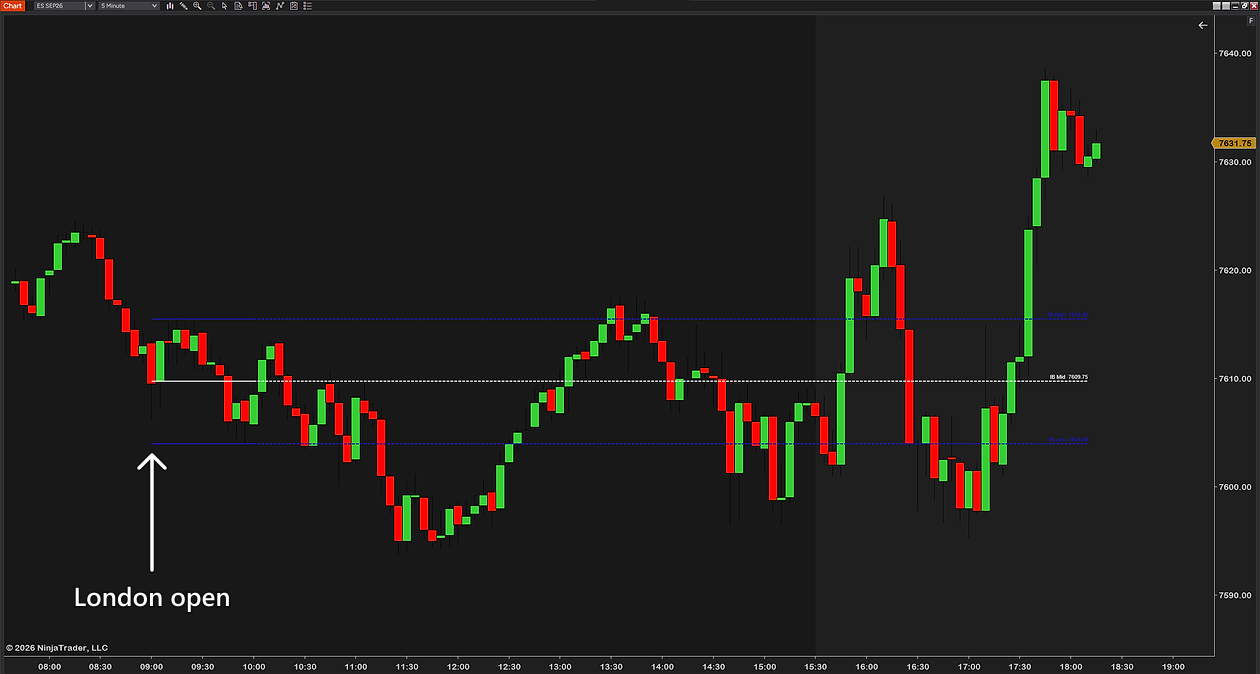
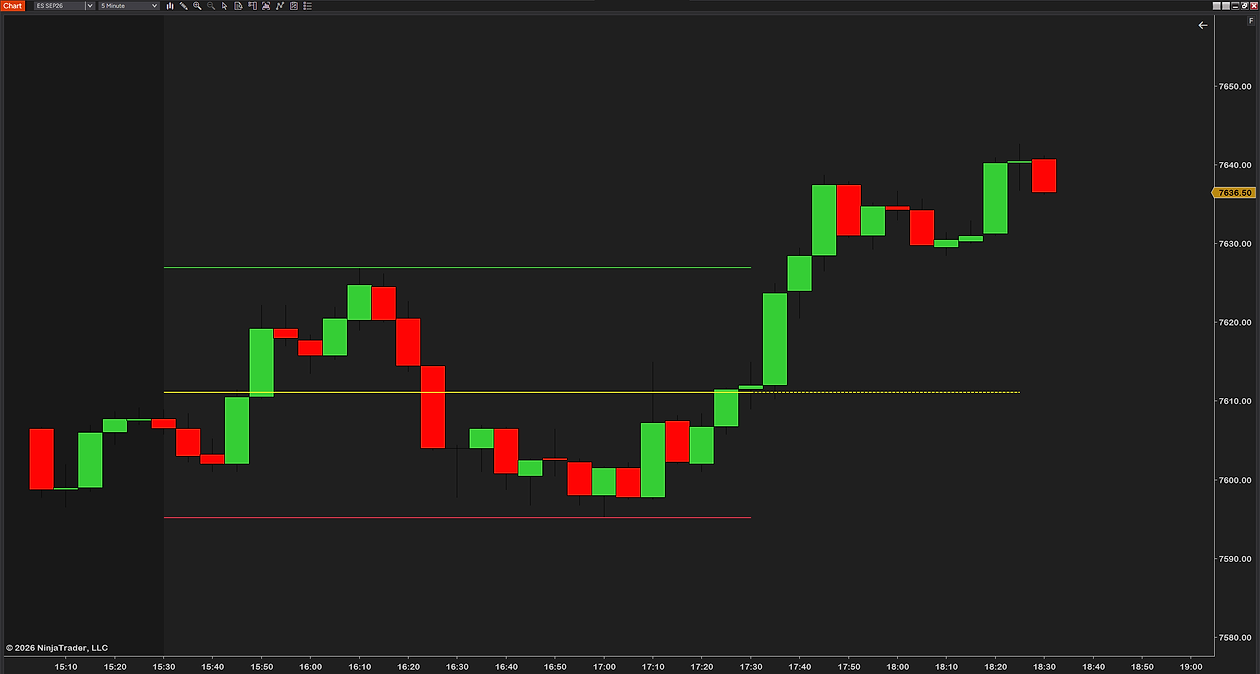
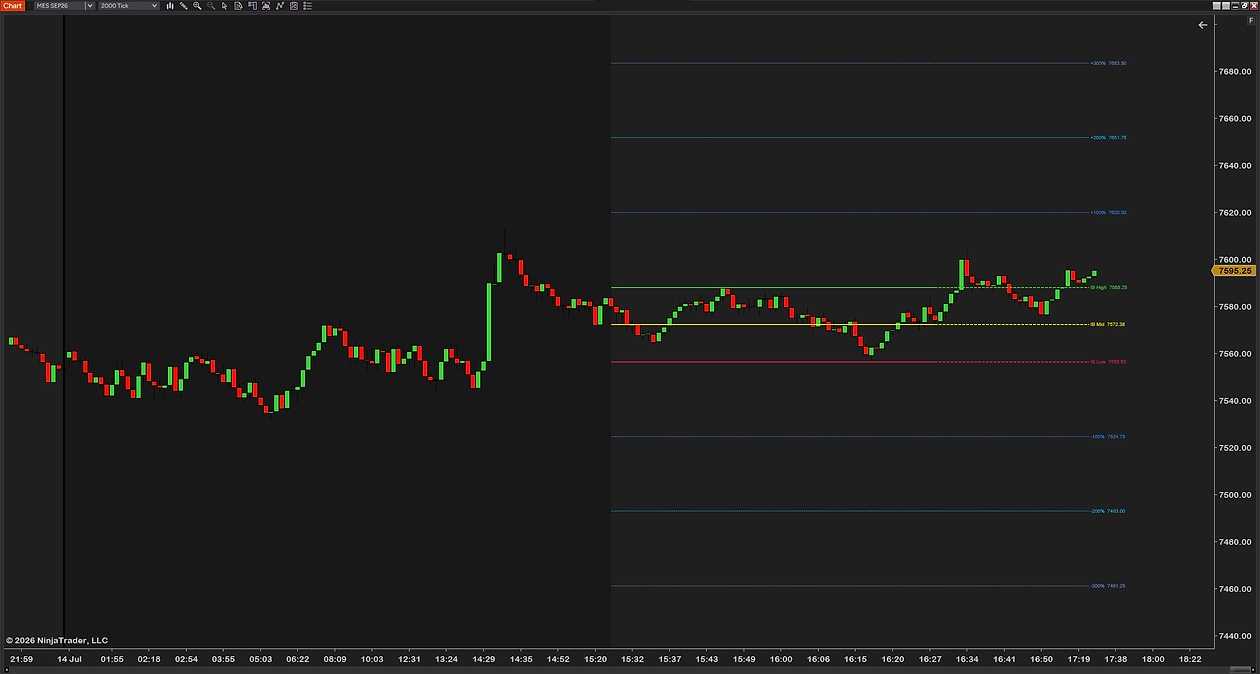
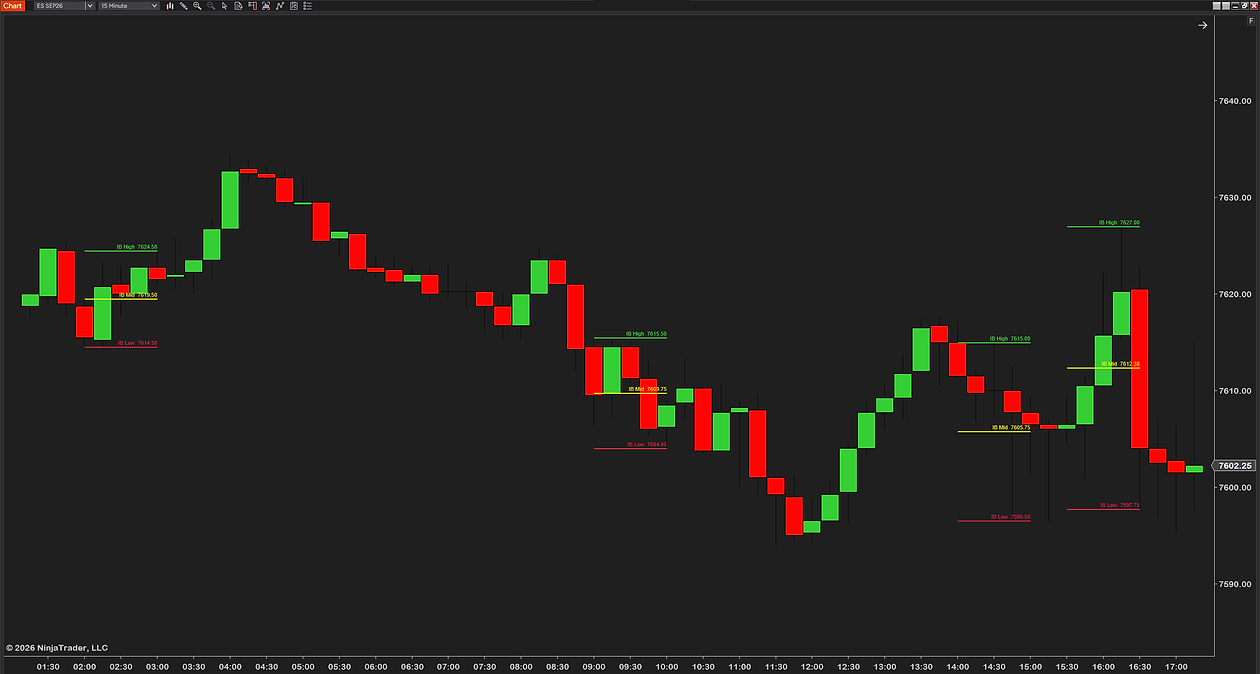
What is the Initial Balance?
The Initial Balance comes from Market Profile. It’s the range established in the first part of the trading day — originally the first two 30-minute periods, so the first hour — measured as the high and low of that window. That opening auction is where the day’s first agreement on value gets made, and it leaves two reference prices on the chart: the IB high and the IB low, with the midpoint often watched too.

What time is the Initial Balance?
The IB is tied to an open, not to a clock — which open depends on what you trade. The classic definition is the first 60 minutes of the regular session, taken from Market Profile’s first two 30-minute periods.
| Session | Instruments | Classic IB window |
|---|---|---|
| US index futures | ES, NQ, YM, RTY and their micros | 09:30–10:30 US Eastern |
| London | European index futures | 08:00–09:00 London |
| Tokyo | Japanese index futures | 09:00–10:00 Tokyo |
| Sydney | Australian index futures | 10:00–11:00 Sydney |
Each of those is the first hour of that market’s own cash open, in its own local time — which is why the window has to follow the session rather than a number on your chart.
Two things trip people up here. The first is daylight saving: the US, Europe and Australia change clocks on different dates, so a window written as a fixed chart time drifts for weeks each year unless the indicator anchors to the session itself. NinjaTrader handles this through its Trading Hours templates, which is where the session — not the clock — is defined. The second is that the futures session opens long before the cash open — ES trades nearly around the clock — so “the open” has to mean the one you actually trade, not the first bar on the chart.
Not everyone uses 60 minutes. A 30-minute IB reacts sooner and is popular with scalpers; a 60-minute IB is the reference most people mean when they say “the IB”. Whichever you pick, keep it the same every day — the level is only useful because other people are watching the same one.

Why futures traders watch it
The IB matters because the market keeps referring back to it:
- A clean break above or below the IB often marks a directional, trending day — the auction has decided to search for value outside the opening range.
- Price staying inside the IB points to a balanced, rotational day — the edges become fade points rather than breakout points.
- IB extensions — projections of the IB width above and below — give measured targets once price does break out.
None of that is a signal on its own. It’s context: a framework for what kind of day you might be in and where the meaningful levels sit.
The four day types, and how the IB tells them apart
Market Profile sorts sessions into a handful of shapes, and the Initial Balance is what you measure them against. Knowing which one you are probably in by late morning is most of the value the IB gives you.
- Normal day. A wide opening hour and very little beyond it. The IB does most of the day’s work; the rest is rotation inside it.
- Normal variation day. The IB gets extended by roughly half its own width on one side. A genuine push, but one that runs out.
- Trend day. Price leaves the IB early and keeps going, and the opening hour ends up a small fraction of the day’s range. These are the sessions where fading the IB edge hurts most.
- Neutral day. Price extends out of both sides of the IB and closes somewhere in the middle — the auction tried both directions and settled on neither.
A rough guide that survives contact with real sessions: a narrow IB is easier to break and more often precedes a directional day; a wide IB tends to hold. That is a tendency, not a rule, and any single session can ignore it. It is useful as a prior, not as a trigger.
Does NinjaTrader 8 have an Initial Balance indicator?
Not built in. You can drop a rectangle or lines on the opening range manually, but you’d be redrawing it every session, guessing the exact window, and you wouldn’t see it build in real time. Most traders who use the IB regularly add an indicator that plots it automatically.
How to plot the Initial Balance on your chart
An IB indicator draws the high, low and midpoint of your chosen opening window — and the good ones do it live, as the range forms, so you watch the IB set rather than seeing it appear after the fact. What to look for:
- Session presets for the open you trade — the US index open is the common one, but London, Tokyo and Sydney matter if you trade around the clock.
- An adjustable window — the classic IB is 60 minutes, but some traders use 30, and it should let you set anything reasonable.
- Extension levels for targets, and the option to keep previous sessions on the chart for reference.
- Correct session timing across daylight-saving changes, so the window doesn’t drift — which in NinjaTrader means respecting the session template rather than a fixed chart time.
Our own free initial balance indicator does all four and is free to download.
IB extensions, and what they are for
An IB extension is the IB’s own width projected above the high and below the low. If the opening hour covered 10 points, the first extension sits 10 points above the IB high and 10 below the IB low, and so on outward.
They are used as measured objectives, not as predictions. Once price leaves the opening range, the market has stopped agreeing on the opening value and is searching for a new one; the extensions mark how far that search has gone in units the day itself set. On a strong trend day price can run through several. On a quiet day it may never reach the first, which is information too.
The practical use is simple: they give you somewhere to measure from that is not an arbitrary round number, and they are the same levels the rest of the auction crowd is looking at.

A worked example
Numbers make this concrete. Say ES opens the regular session and the first hour, 09:30 to 10:30 Eastern, covers 5,300.00 at the high and 5,290.00 at the low.
- The IB width is 10 points — 40 ticks at 0.25 a tick.
- The midpoint is 5,295.00, the level the day rotates around while it is still balanced.
- The first extension sits 10 points beyond each edge: 5,310.00 above and 5,280.00 below.
Ten points is a middling opening hour for ES — neither the tight 5-point open that tends to break nor the 25-point open that usually contains the day. So the prior is weak, and you let the session tell you.
If price pushes through 5,300.00 and holds above it into the late morning, the day is leaning directional and 5,310.00 is the first measured objective. If it pokes through, fails, and comes back inside within a few bars, that failed break is the more useful signal — the auction tried to find value higher and was rejected, which often turns the IB high into resistance for the rest of the session.
None of that is a trade on its own. It is a framework for what the day is doing and where the levels that matter sit.
IB vs opening range vs VWAP
These three get used interchangeably and they are not the same thing.
| Reference | What it measures | Window | What it is good for |
|---|---|---|---|
| Initial Balance | The high and low of the opening auction | Fixed: the first hour of the session | Deciding what kind of day you are in |
| Opening range | The high and low of a window you choose | Whatever you set — 5, 15 or 30 minutes | Faster breakout setups, earlier in the day |
| VWAP | The volume-weighted average traded price | Runs continuously all session | Whether price is trading rich or cheap right now |
The practical difference: the IB and the opening range are static levels set early and then left alone, while VWAP moves all day. They answer different questions, and plenty of traders run the IB for structure and VWAP for location at the same time.
The opening range is the more flexible of the two static ones, but that is also its weakness — because everyone picks their own window, fewer people are watching the same line. The IB’s one hour is a convention, and the convention is most of why it works. If you want either on the chart without drawing it by hand, our free opening range breakout indicator for NinjaTrader 8 draws the initial balance or any window from 5 to 240 minutes live, with the extension targets.
Sizing a trade around the IB
The IB sets the levels; it does not set your size. The arithmetic that does is the ordinary one: contracts = risk budget ÷ (stop distance in ticks × tick value), always rounded down, because a fraction of a contract does not exist.
What the IB changes is where a sensible stop goes. If you are trading a break of the IB high, the stop usually belongs back inside the range rather than at a round number — which means a wide opening hour forces a wider stop and therefore a smaller position. On the 10-point example above, a stop back below the midpoint is 5 points, 20 ticks, $250 a contract on ES.
That is the part people skip. A wide IB is not just a different day type, it is a different position size.
Four mistakes worth avoiding
- Treating the IB break as a signal. It is context. Plenty of sessions poke out of the IB and come straight back — that failed break is often the more useful piece of information than the break itself.
- Letting the window drift. If the IB is drawn from a fixed chart time rather than the session, it moves every time the clocks change, and the level you are watching is no longer the level anyone else is.
- Changing the length to suit the day. Switching between 30 and 60 minutes depending on what looks better is fitting the tool to the outcome. Pick one and keep it.
- Using it on a market that has no real open. The IB means something because the opening auction means something. On instruments that trade thinly around the clock with no concentrated open, it is just a range.
How to install it
- Download the free initial balance indicator — keep it zipped.
- Open the Control Center → Tools → Import → NinjaScript Add-On… and select the .zip. NinjaTrader documents the full process in its import guide, and we walk through every step, error message and the update rule on our installation page.
- On a chart, right-click → Indicators…, add it, and set your session and window. The session itself comes from the chart’s Data Series settings.
Common questions
What is the Initial Balance in futures trading?
It is the price range — the high and low — set during the opening period of the session, classically the first hour. It comes from Market Profile, and it leaves two reference prices on the chart: the IB high and the IB low, with the midpoint often watched too.
What time is the Initial Balance?
It is tied to an open rather than a clock. For US index futures such as ES and NQ the classic window is 09:30 to 10:30 US Eastern, the first hour of the regular session. Other sessions use the first hour of their own local cash open.
Does NinjaTrader 8 have a built-in Initial Balance indicator?
No. NinjaTrader 8 has no built-in IB tool. You can draw the opening range by hand with a rectangle or lines, but you would redraw it every session and you would not see it build in real time, so most traders who use the IB add an indicator that plots it automatically.
Is the Initial Balance 30 minutes or 60 minutes?
Sixty is the classic definition — Market Profile’s first two 30-minute periods. A 30-minute IB reacts sooner and is popular with scalpers. Either works, as long as you keep it the same every day; the level is useful because other people are watching the same one.
What are IB extensions?
An IB extension is the width of the Initial Balance projected above its high and below its low. They are used as measured objectives once price leaves the opening range, not as predictions.
What is the difference between the Initial Balance and the opening range?
The Initial Balance is a fixed one-hour window by convention. An opening range is whatever window you choose — commonly 5, 15 or 30 minutes. The IB’s fixed hour is why more traders are watching the same levels.
Does the Initial Balance work on instruments other than index futures?
It works wherever there is a real opening auction to measure. On instruments that trade thinly around the clock with no concentrated open, the first hour is just a range and the idea loses most of its meaning.
Related guides
- Previous-day high, low and the session opens — the other reference levels the day organizes around.
- How to add and use VWAP — where the average traded price sits, which pairs naturally with the opening range.
- Reading trend across timeframes — useful for deciding whether an IB break has anything behind it.
The honest part
The Initial Balance won’t tell you to buy or sell. It tells you where the opening range sits and what kind of day the auction is building — and that context is what a lot of good decisions are made from. Plot it, watch how price behaves around it for a few sessions, and decide for yourself how much weight it earns on your chart.