Why Is My NinjaTrader Chart Lagging? How to Find the Cause
A laggy chart is almost always one of four things, and fixing the wrong one wastes a week. Here’s a test that narrows it down in order, and what NinjaTrader can actually show you.
The four things that cause it
“Lag” feels like one problem. It is four, and they look identical from the chair:
- Your internet connection. High ping, jitter — an unstable ping rather than a slow one — or packet loss makes ticks arrive late or in bursts. The most common cause and the easiest to miss, because a speed test can read perfectly while the connection is unstable second to second.
- The data feed. The feed itself slows, stalls or briefly drops. Nothing to do with your machine, and nothing you can fix from your end.
- NinjaTrader. Too many indicators, charts or drawing objects, and the platform falls behind the data it is being given.
- The PC. Background software, a Windows update mid-session, or a machine that was never quick enough sits underneath all three.
The trap is fixing the wrong one: buying a faster PC when the real problem was a flaky connection, or blaming the broker when NinjaTrader is simply overloaded. So locate it before you change anything.
The four-step test, in order
Run these while the chart is actually lagging. The order matters — each step rules out a cause, and they are arranged from most common to least.
Step 1: is anything arriving at all?
Look at whether the chart is slow or stopped. A slow chart still prints ticks, just late. A stopped chart prints nothing while the market is clearly moving. If it has stopped, this is a feed or connection problem and steps 3 and 4 are a waste of time — go straight to telling a feed stall from your own lag.
Step 2: is it one chart or all of them?
Open a second chart on a different instrument, ideally a quiet one. If the new chart is fine and the original still lags, the problem is that chart — its indicators, its drawing objects, its bar type. If every chart lags together, the problem is upstream: the connection, the feed or the machine.
This single step separates “NinjaTrader is overloaded by what I put on it” from everything else, and most people never try it.
Step 3: is NinjaTrader spending too long on your scripts?
Open the NinjaScript Output window, right-click it, and open the NinjaScript Utilization Monitor. It reports how much time your indicators and strategies are taking. If one is dominating, you have found your answer, and the fix is that script rather than your broadband.
Step 4: is it the machine or the line?
With Task Manager open next to the chart, watch CPU and memory during a lag episode. A CPU pinned near 100% explains everything above it. If CPU and memory are comfortable and the chart still lags, you are back to the connection — and the thing to watch there is stability, not headline speed. A 50 Mbps line with erratic ping delivers ticks worse than a steady 10 Mbps one.

What NinjaTrader can show you
Three genuine things, and it is worth knowing exactly what each one is:
| Where | What it tells you |
|---|---|
| Connection status, Control Center | Whether you are connected, and whether a connection has dropped. Binary, not a measure of quality |
| NinjaScript Utilization Monitor | How much time your scripts are consuming. Right-click the NinjaScript Output window to open it |
| “Time last tick” column, Market Analyzer | The time the last trade occurred. The one native way to catch a stalled feed: if that timestamp stops advancing while the market is open, nothing is arriving |
One name trap worth flagging. There is an indicator in the list called Performance, and it is not a system monitor. It plots the percent change of the current value against the first value in the loaded series — a price study. Adding it to diagnose lag tells you nothing about your machine.
What it cannot show you
Nothing in NinjaTrader reports your connection quality or your machine’s load. Checked against the platform’s own indicator list and all of its Market Analyzer columns: no ping, jitter or packet-loss reading, no latency column, and nothing showing the CPU and memory your own PC is using.
That is the real problem with diagnosing lag. The four numbers you need live in four different places — Control Center, the Output window, Market Analyzer and Task Manager — and lag usually appears mid-session and is gone before you have opened the third one.
Reducing the load NinjaTrader is under
If step 2 pointed at the chart itself, these are the things that actually move the needle, roughly in order of effect:
- Cut the bars loaded. Days-to-load is the setting people leave at a number they chose once. Thirty days of 1-minute data is about 43,000 bars for every indicator on the chart to walk through.
- Remove indicators you no longer read. Not the ones you like — the ones you stopped looking at months ago.
- Clear old drawing objects. They persist, they accumulate, and they are redrawn every frame.
- Watch tick charts specifically. A low tick count on a fast instrument generates bars at a rate that magnifies every other cost on the chart.
- Fewer charts on one workspace. Everything above, multiplied.
Telling a feed stall from your own lag
These feel the same and have opposite fixes, so it is worth being able to separate them in a few seconds.
It is the feed if the last trade time stops advancing while the market is plainly open, if every instrument stops at once, and if a second platform or a phone app shows price moving while yours does not.
It is you if ticks are still arriving but late, if some instruments are worse than others, or if the chart catches up in a burst after a pause — that burst is data that was queued somewhere between the feed and your screen.
A feed stall is not something you can fix. Knowing that inside ten seconds is still worth a great deal, because it stops you restarting the platform mid-trade for no reason.
Seeing all four at once
The reason lag is hard to pin down is not that the information is secret. It is that it is scattered, and it matters exactly when you are least able to go hunting for it.
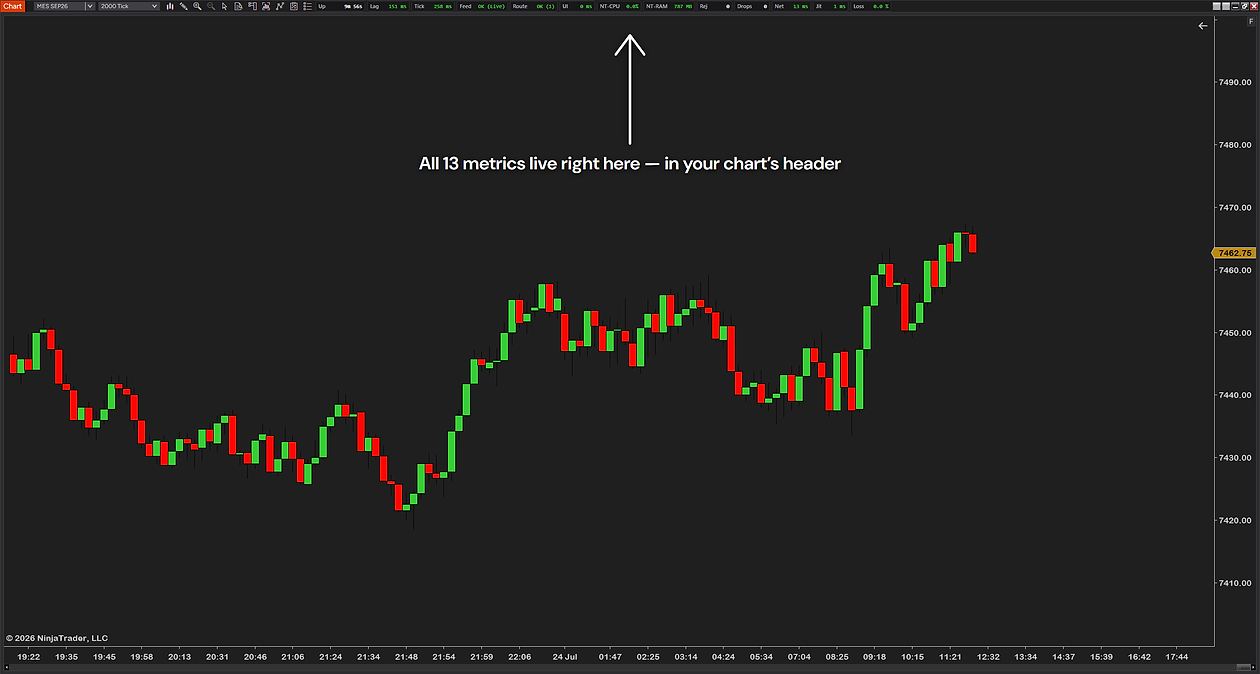
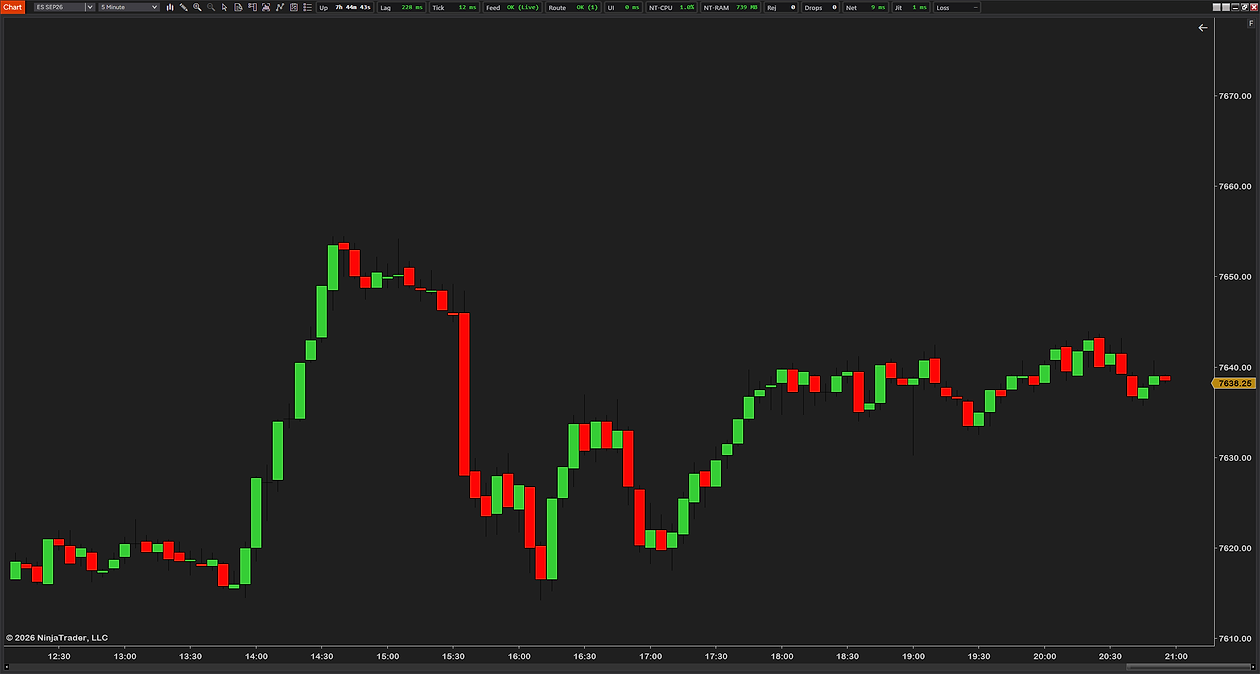
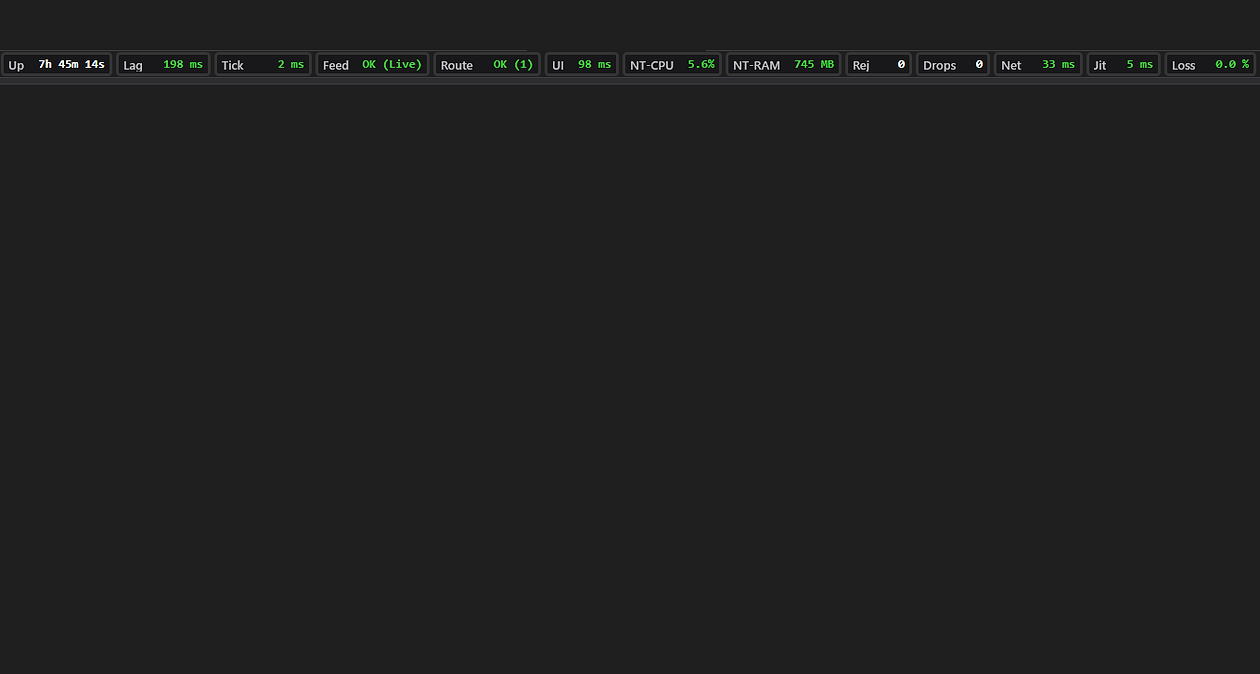
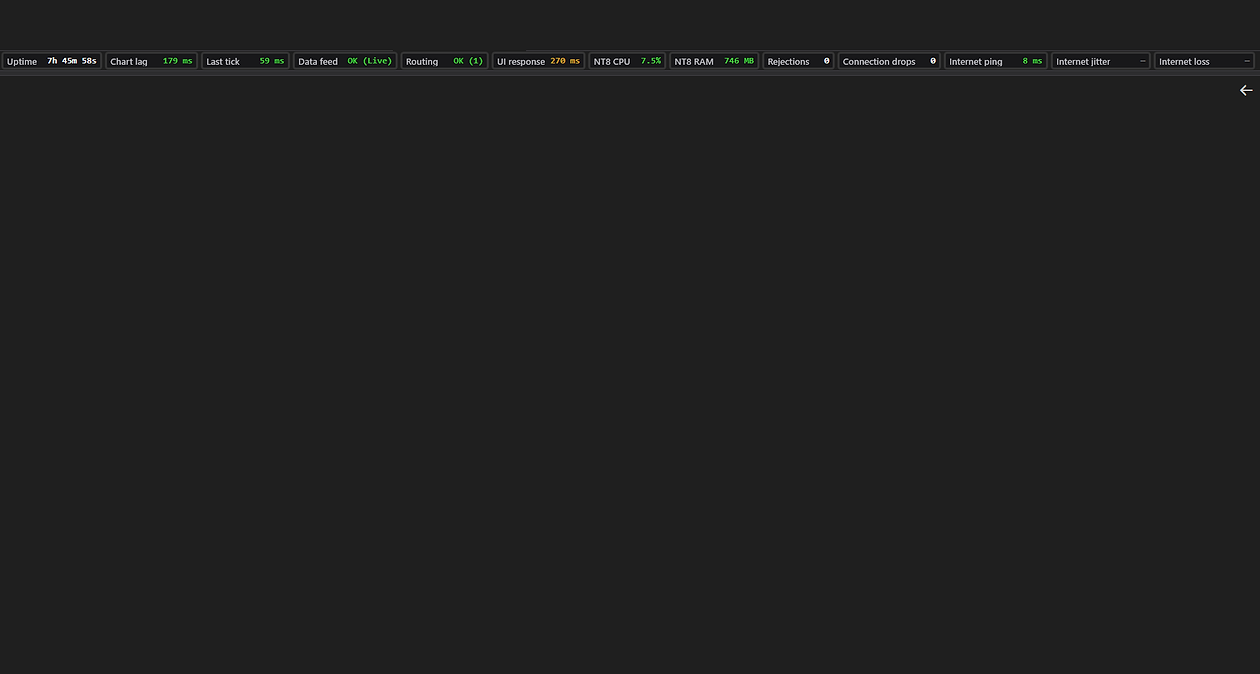
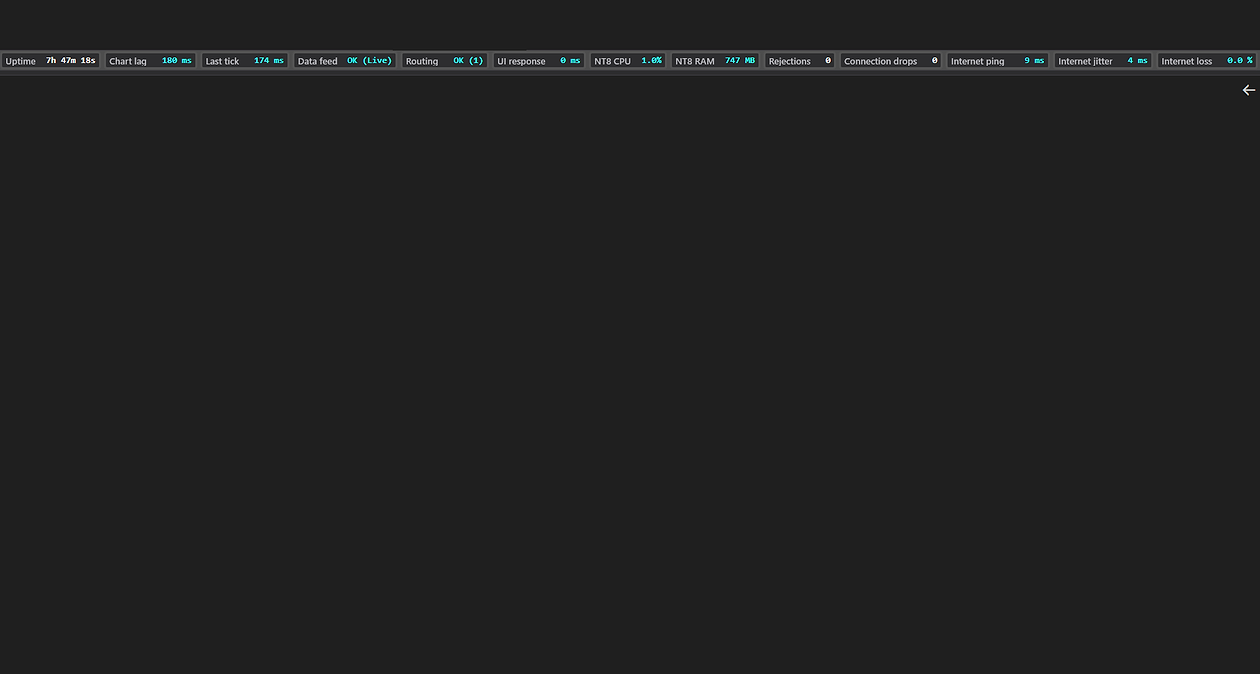
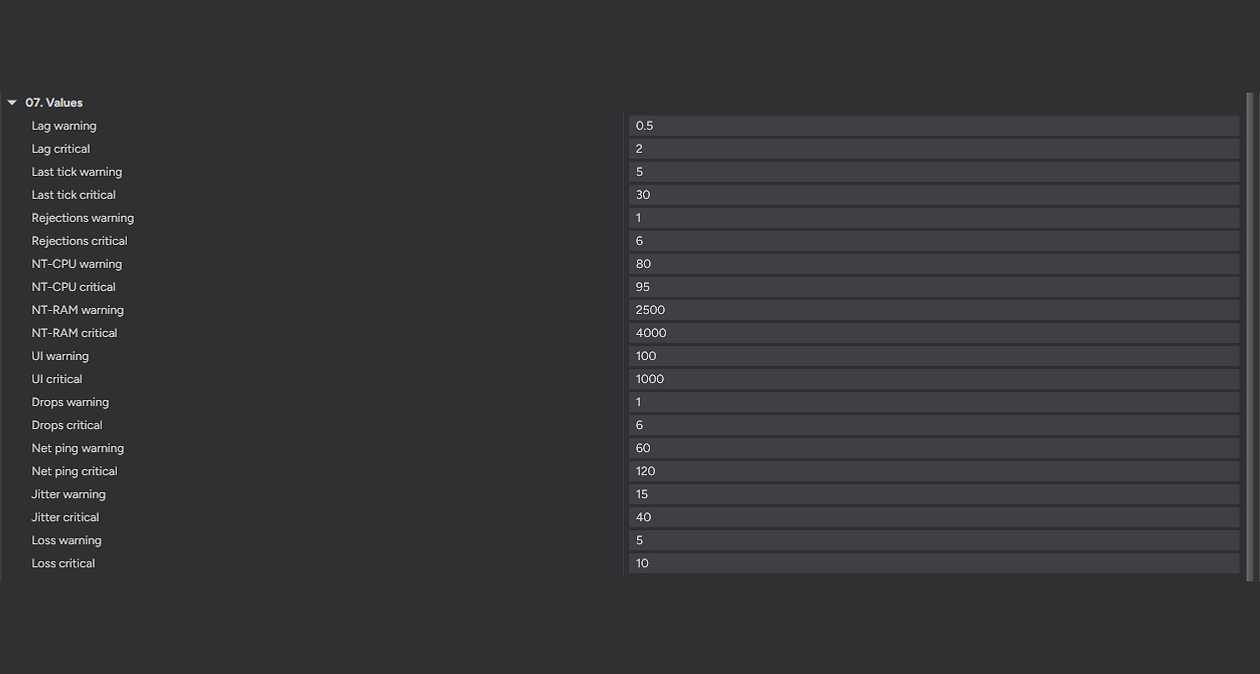
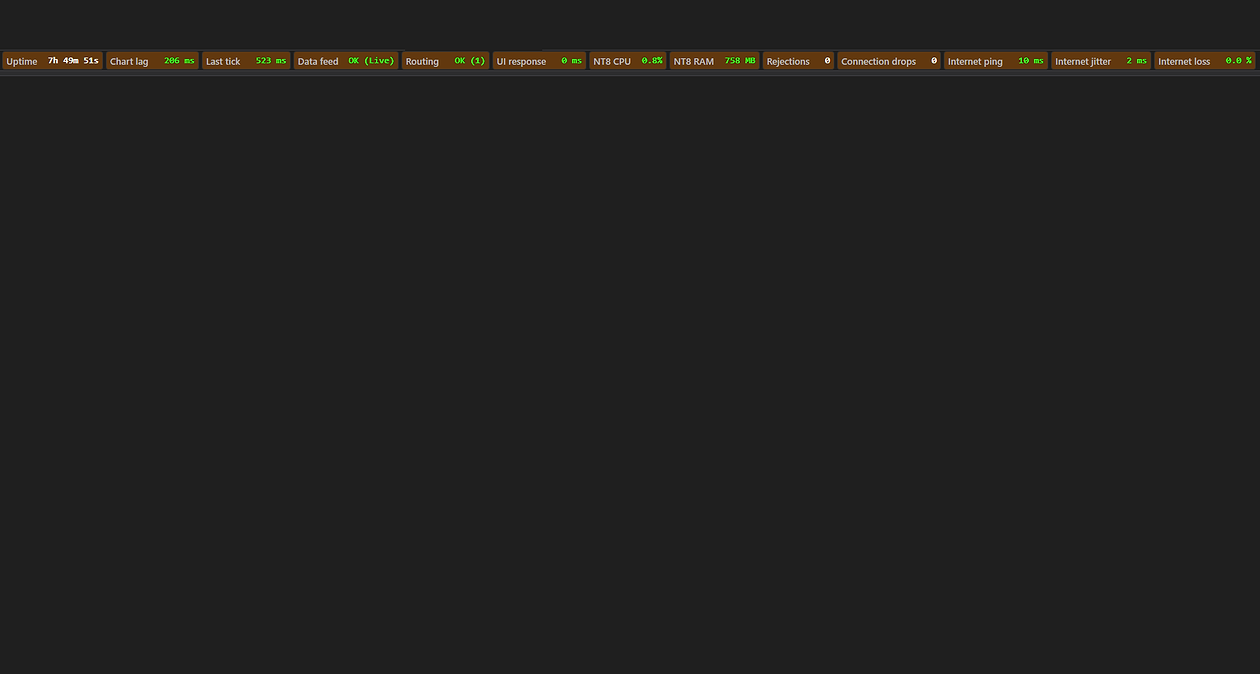
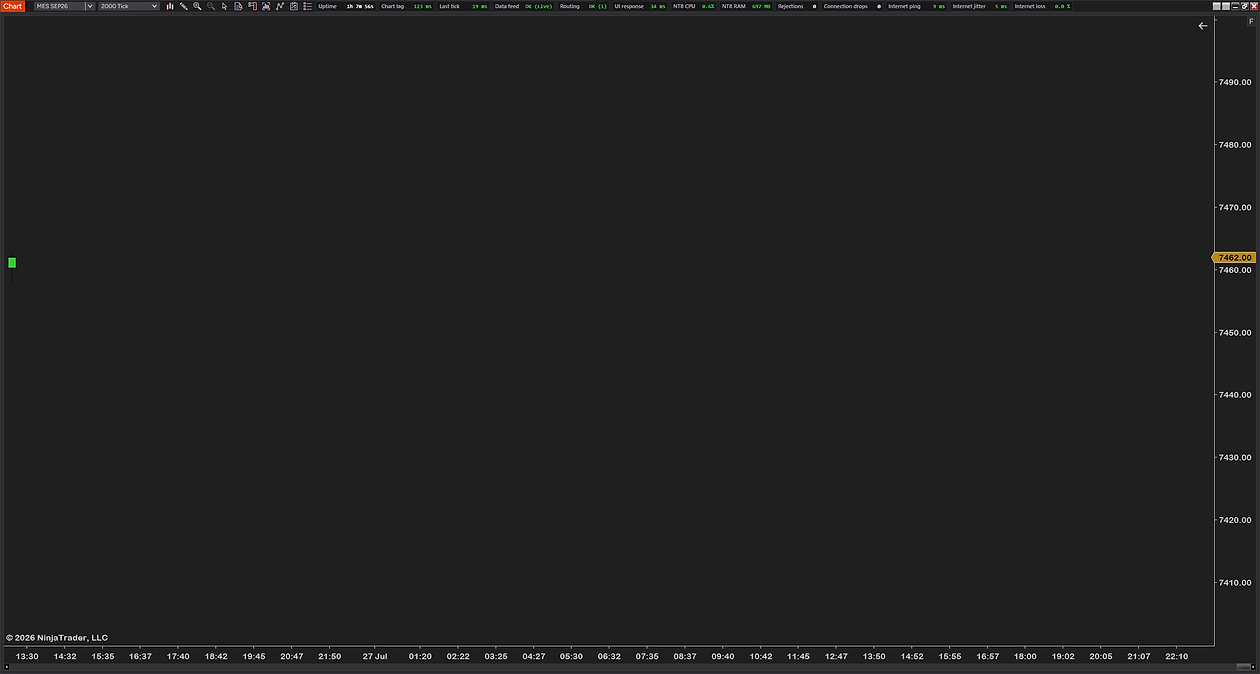
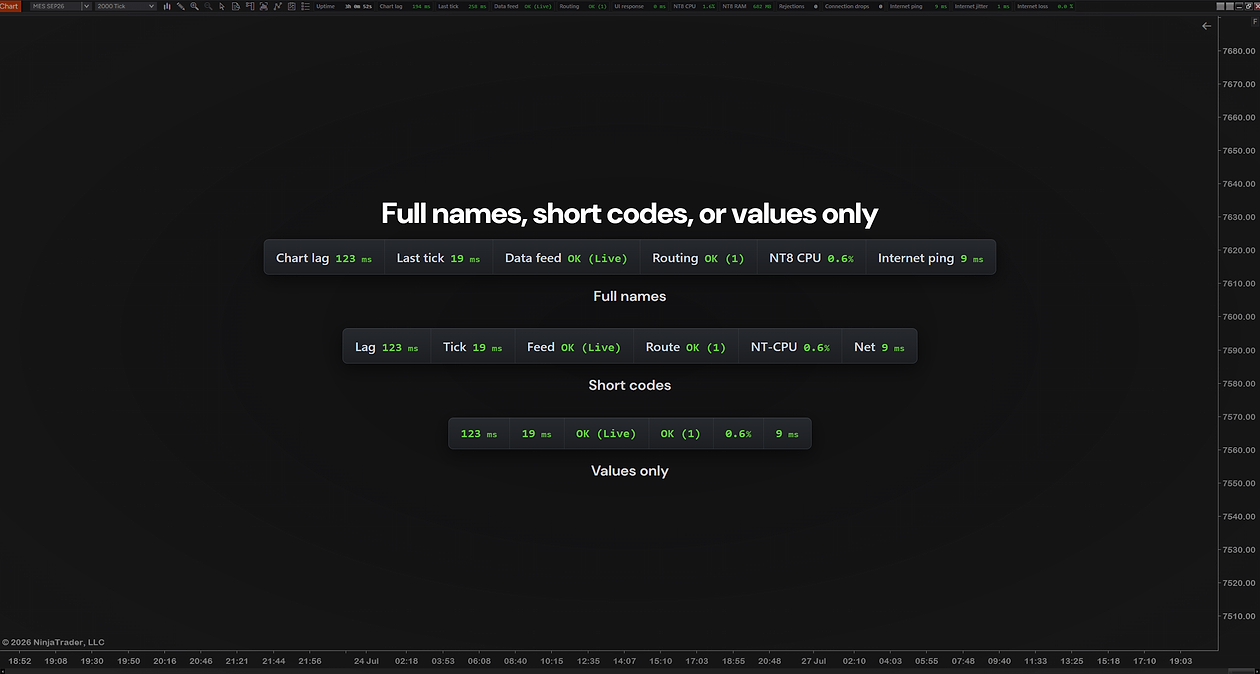
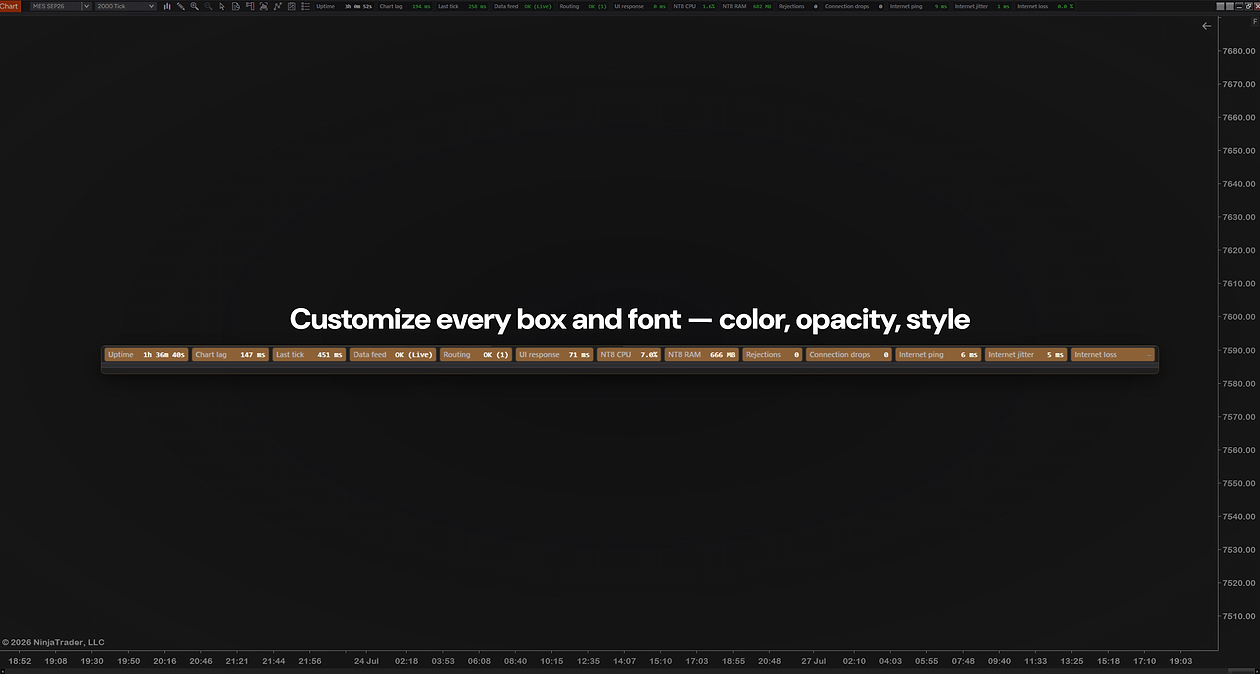
Putting the four readings in the chart header solves that: connection quality, feed status, NinjaTrader’s own CPU and memory, and whether anything has dropped — visible while you trade rather than reconstructed afterwards. Our own free connection and system-health HUD does that and is free to download.
How to install it
- Download the free system health HUD — keep it zipped.
- Open the Control Center → Tools → Import → NinjaScript Add-On… and select the .zip. NinjaTrader documents the process in its import guide, and we walk through every step, error message and the update rule on our installation page.
- On a chart, right-click → Indicators…, add it, and choose which readings you want visible.
Common questions
Why is my NinjaTrader chart lagging?
It is one of four things: your internet connection, the data feed, NinjaTrader being overloaded by what is on the chart, or the PC underneath. They look identical from the chair and need different fixes, so the useful first move is a test that rules causes out in order rather than changing something and hoping.
Does NinjaTrader have a built-in lag or latency monitor?
Not for your own system. There is no ping, jitter, packet-loss, CPU or memory reading for your PC or your line. You get a connection status in the Control Center, the NinjaScript Utilization Monitor for script load, and a "Time last tick" column in the Market Analyzer that reveals a stalled feed — but nothing that measures the quality of your connection or the load on your machine.
How do I know if it is my internet or the data feed?
Check whether the last trade time is still advancing. If it has stopped while the market is open and every instrument has stopped together, the feed has stalled. If ticks are still arriving but late, or the chart catches up in a burst after a pause, the delay is between the feed and your screen.
What is the NinjaScript Utilization Monitor?
A built-in tool that reports how much time your indicators and strategies are consuming. Open the NinjaScript Output window, right-click it, and choose the NinjaScript Utilization Monitor. If one script dominates, that script is your lag.
Is the "Performance" indicator a system monitor?
No, and the name misleads people. NinjaTrader's Performance indicator plots the percent change of the current value against the first value in the loaded series. It is a price study and tells you nothing about CPU, memory or connection.
How many bars should I load to keep charts fast?
As few as you actually look at. Days-to-load is usually set once and forgotten; thirty days of 1-minute data is roughly 43,000 bars that every indicator on the chart has to process. Cutting it is normally the single biggest speed win.
Will a faster internet connection fix chart lag?
Only if the connection is the cause, and headline speed is rarely the issue. Stability matters more than bandwidth: a steady 10 Mbps line delivers ticks more reliably than an erratic 50 Mbps one. Test before you upgrade.
Related guides
- The bar timer and countdown — its "waiting for realtime data" message is another early sign that nothing is arriving.
- Changing candlestick colors — chart styling is presentation only and is not what is slowing you down.
- Reading trend across timeframes — one of the common reasons a workspace ends up carrying more charts than it needs.
The honest part
No tool makes a slow connection fast or a tired PC quick. What it does is stop you guessing — and guessing is what costs the money here, because the wrong fix is expensive and the right one is often free. Find out which of the four it is, then decide whether it is worth spending anything at all.