NinjaTrader’s Economic Calendar: Where It Is, and How to Get It on the Chart
NinjaTrader does have an economic calendar — most people never find it, because it is a separate window rather than anything on the chart. Here is where it lives, what it shows, and how to get releases onto the chart itself.
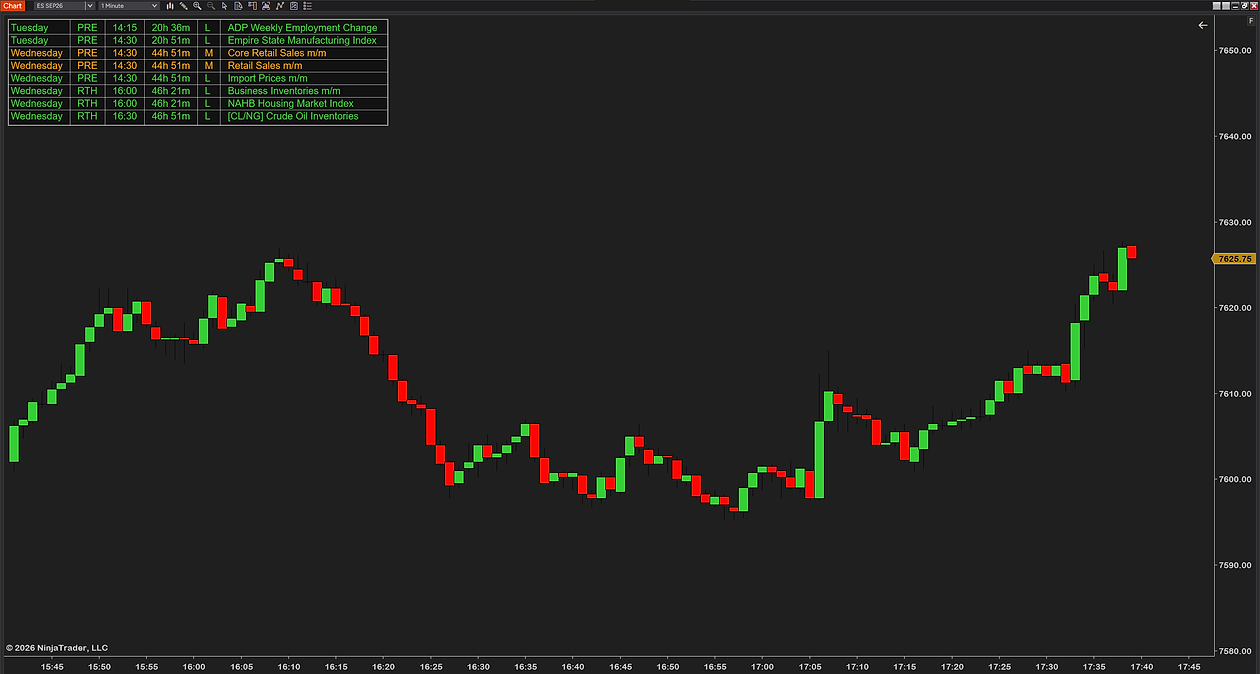
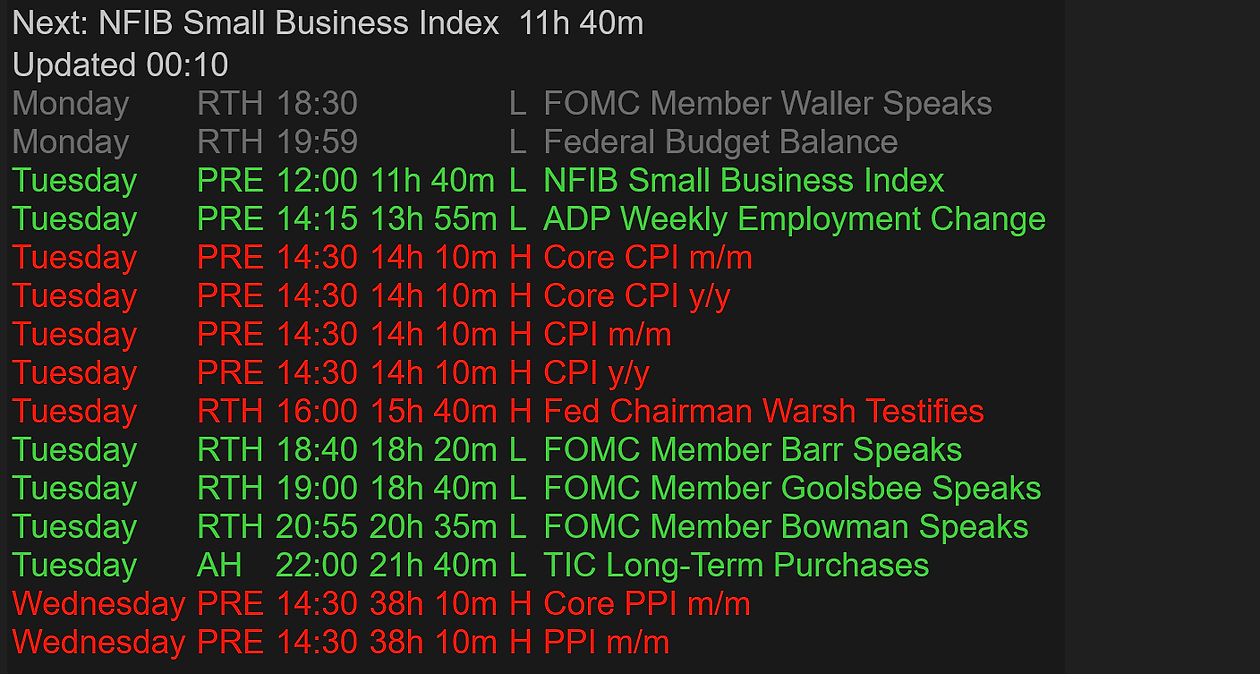
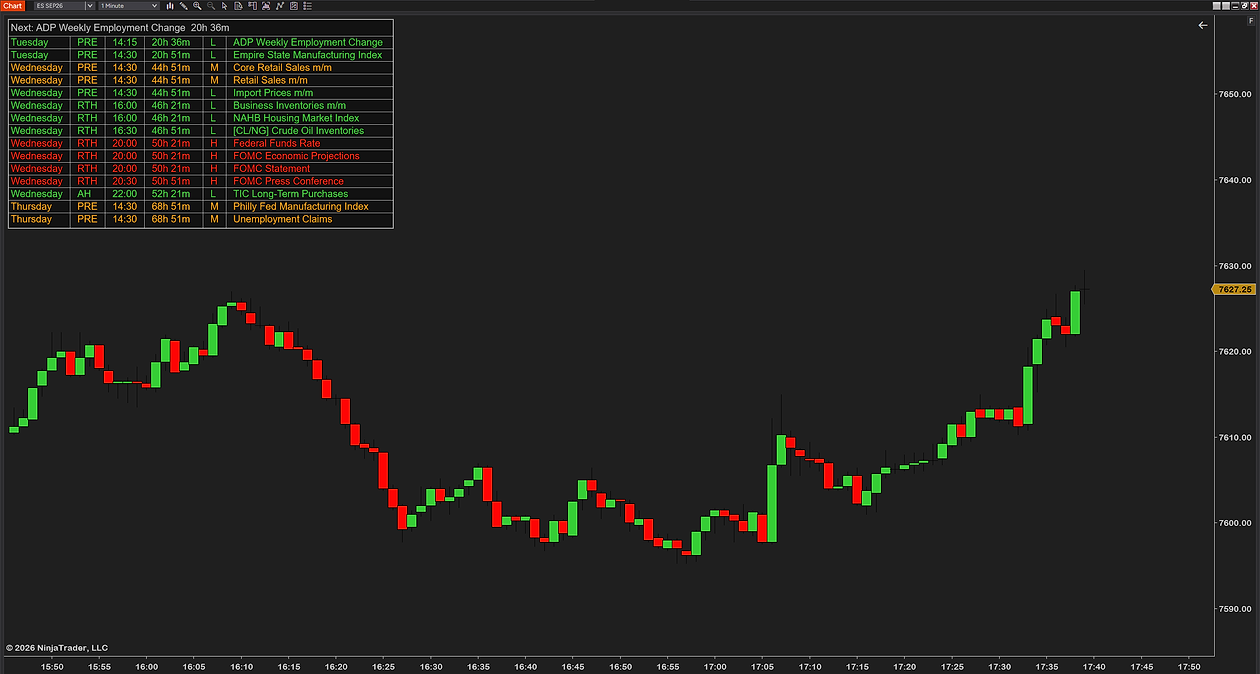
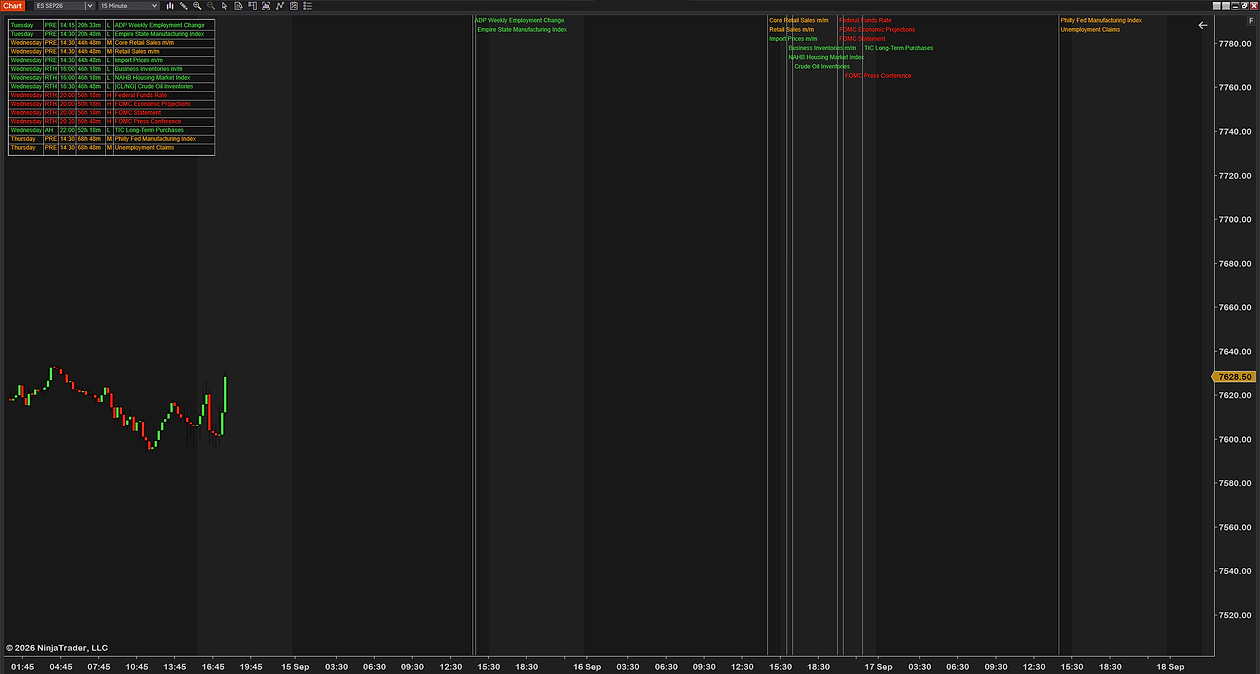
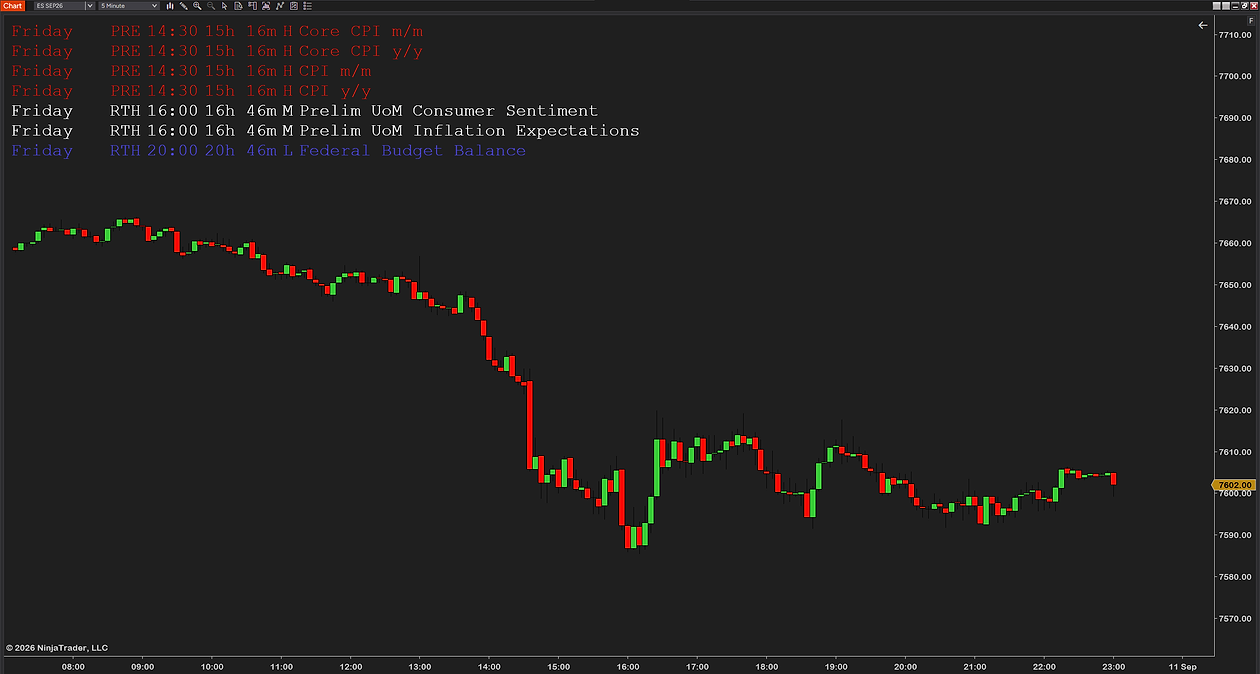
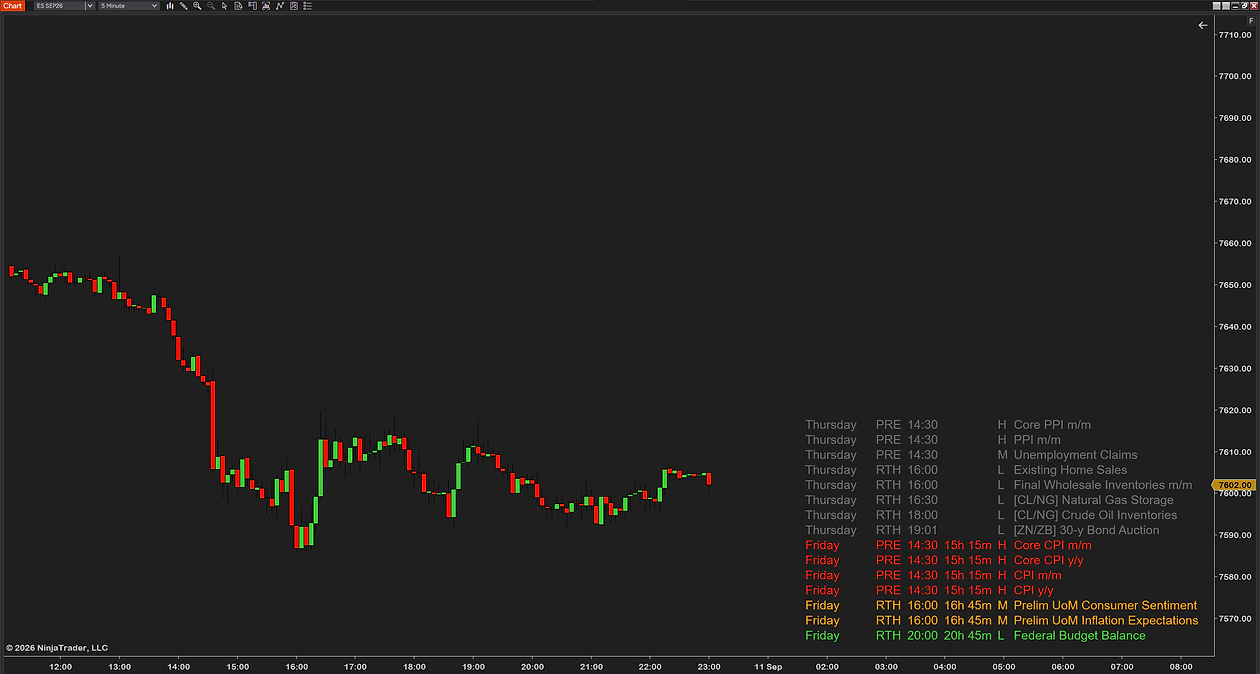
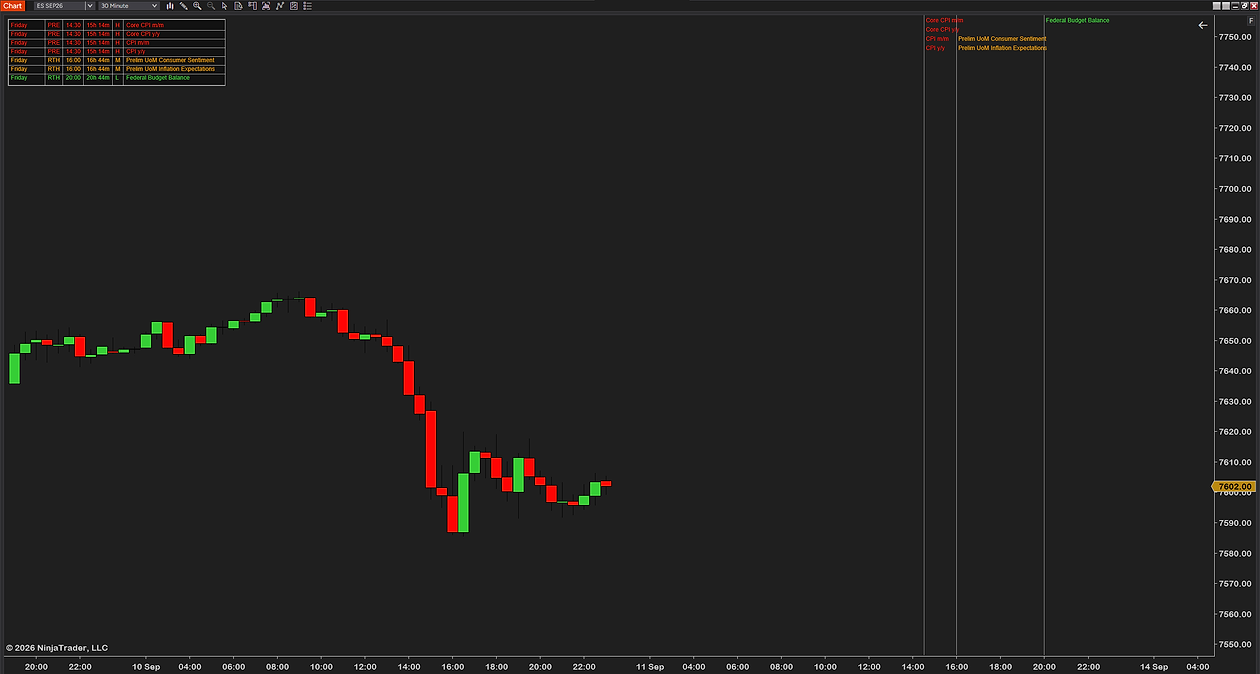
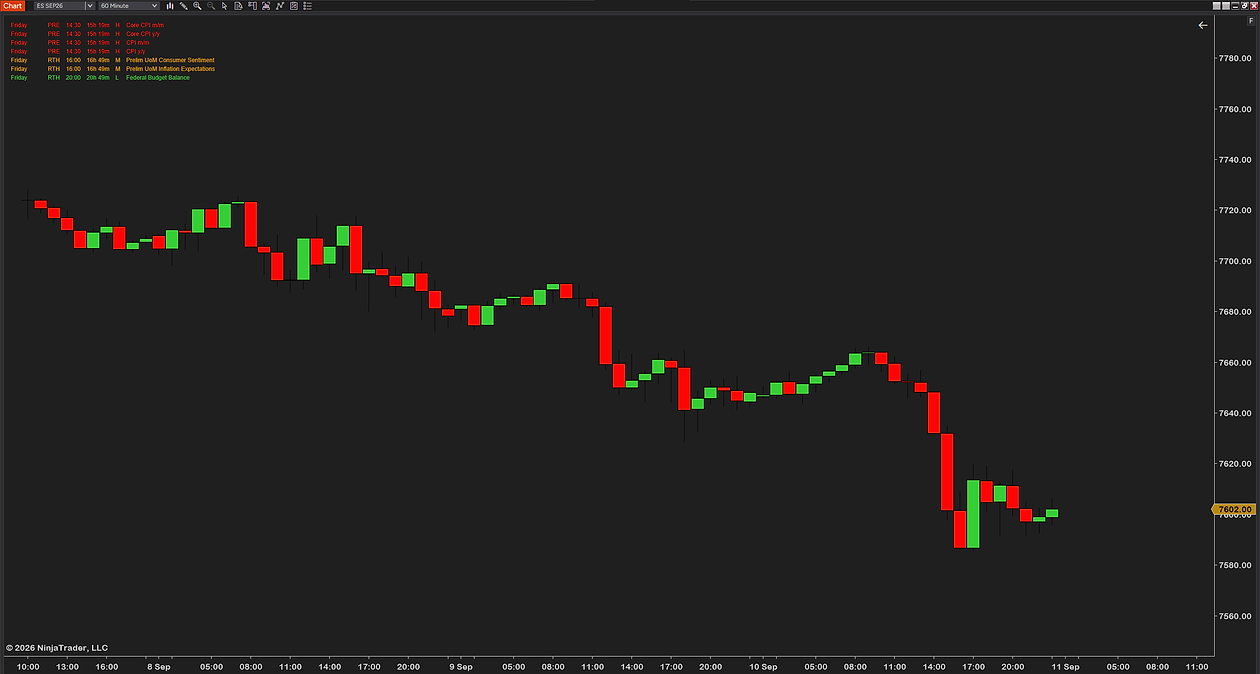
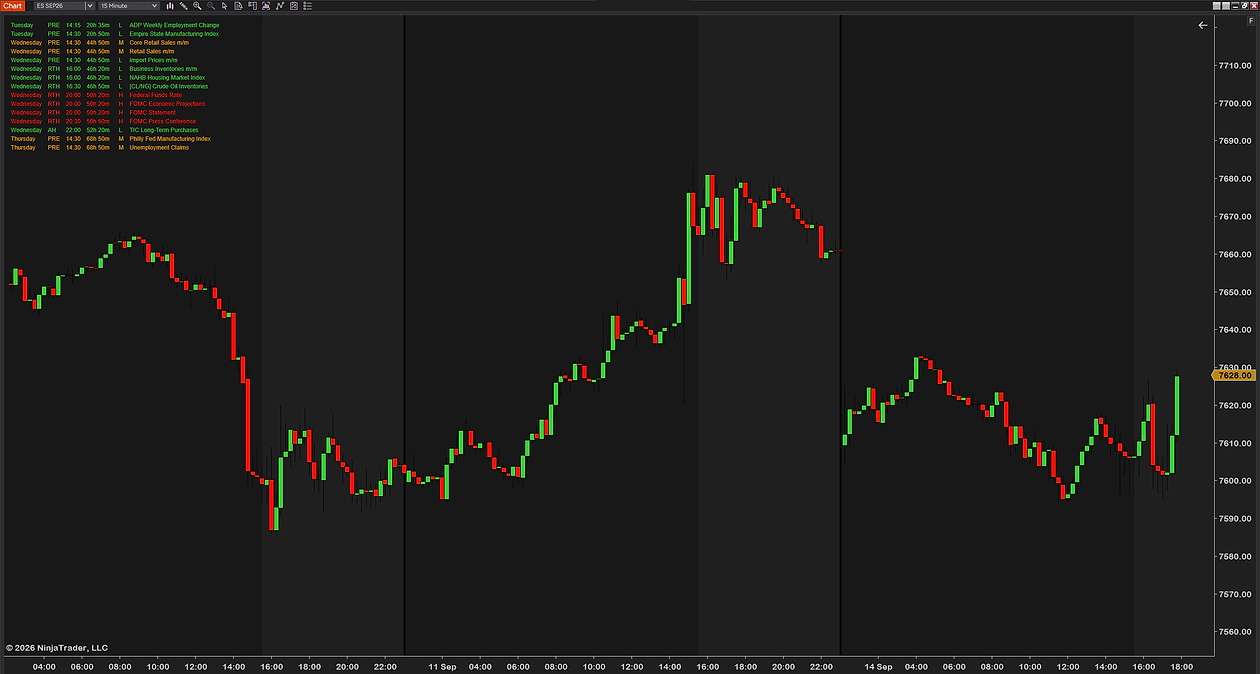
![Futures News Indicator on a 1-minute ES chart, the transparent panel in the top-left corner: Tuesday and Wednesday releases with their times, colored by impact, the crude-oil report tagged [CL/NG]](/assets/images/indicators/news/crisp/fni-5-1260.png)
Yes — the Calendar and News windows
People assume NinjaTrader has no calendar because they have never seen one. It has two relevant windows, and both are opened the same way: from the Control Center, click the New menu.
- New → Calendar opens the economic calendar. It lists scheduled releases with their date and time, event name, impact, actual, consensus and prior figures, and marks when a row was last updated.
- New → News opens the news window — headlines with their symbols and times, and a reading pane. NinjaTrader documents that you receive real-time news only if you are subscribed to a news service through a market data vendor or broker, so what arrives here depends on your connection rather than on the platform.
So the calendar is there, it is free, and it has the columns you would want. That is worth knowing before you go shopping for anything.
Why neither helps while you are trading
Both windows have the same limitation: they are windows. They sit beside your charts or behind them, which means they work exactly like the browser tab they replace — useful when you remember to look, invisible when you do not.
Nothing in NinjaTrader puts a scheduled release on the chart. Checked against the platform: there is no news or calendar indicator in the chart indicator list, and no calendar column in the Market Analyzer. The only Market Analyzer entries with “Calendar” in the name are Calendar Year High and Calendar Year Low, which report the year’s highest and lowest traded price and have nothing to do with events.
That is the real gap, and it is narrower and more honest than “NinjaTrader has no calendar”. The calendar exists. It is just not next to the price you are watching, and there is no countdown telling you how long you have.
Which releases actually move index futures
Most of a calendar is noise for an ES or NQ trader. The releases that reliably move index futures cluster into a short list, and they land at consistent times — which is the useful part, because it means you can recognize a dangerous slot on the clock even before you check what is in it.
| Release | Usual time (US Eastern) | When |
|---|---|---|
| CPI | 08:30 | Monthly |
| Non-farm payrolls | 08:30 | First Friday of the month |
| PCE price index | 08:30 | Monthly |
| Retail sales, GDP, PPI | 08:30 | Monthly / quarterly |
| Initial jobless claims | 08:30 | Every Thursday |
| ISM, consumer confidence | 10:00 | Monthly |
| FOMC statement | 14:00 | Eight times a year |
| EIA crude inventories | 10:30 | Wednesdays (energy, not index) |
Two patterns fall out of that. Almost all US macro data lands at 08:30 Eastern, an hour before the equity cash open — which is why the pre-market hour around a CPI print behaves nothing like a normal one. And the 14:00 FOMC slot sits in the middle of the afternoon session, where a position taken at 13:55 has no time to be right.
Treat the times as the usual schedule rather than a guarantee. Agencies do move things, and a calendar feed is the thing that stays current; the value of knowing the pattern is that you recognize the shape of a dangerous day at a glance.

The three ways traders track it, and why they fail
- A browser tab. Accurate and free. It is also behind your charts, which means you check it when you remember to — and the session you forget is the session it mattered.
- Your phone. Same problem plus a notification you will silence within a week, because most of what a general calendar app sends you does not move index futures.
- Memory. Works for FOMC. Does not work for the Thursday claims print that catches you at 08:29 with a position on.
None of these is stupid, and NinjaTrader’s own Calendar window is a better version of the first one. They fail for the same structural reason: the information is somewhere other than where your eyes are.
Getting the calendar onto the chart
A news trading indicator for NinjaTrader 8 is a NinjaScript add-on that does two jobs. It fetches an economic calendar automatically, so you maintain nothing, and it draws the events on your chart at their real times.
The good ones show both views, because they answer different questions. A vertical line on the time axis tells you something happens here — useful when you are looking at the chart anyway. A panel with the next few events and a live countdown tells you what it is and how long you have — which is what stops you opening a position ninety seconds before the number.
What separates a useful news indicator from clutter
- Impact filtering. Dozens of releases hit every day and most move nothing. A wall of every minor data point is worse than showing nothing at all, because you stop reading it.
- The right events for what you trade. An ES or NQ trader needs CPI, FOMC and payrolls. A crude trader needs EIA inventories. Grouping events by instrument is the difference between a calendar and your calendar.
- Session labeling. The same number matters differently at 08:30 pre-market than at 14:00 mid-session. Knowing which is worth as much as knowing the time.
- A countdown, not a date. “Today” is not actionable. “Six minutes” is.
- Quiet by default. If it buries the price you will turn it off, and then it cannot help you.
The timezone trap
A calendar with the times an hour out is worse than no calendar, because you will trust it. Two things cause it.
The first is daylight saving. The US, Europe and Australia change clocks on different dates, so for a few weeks each year a release that is normally 08:30 Eastern lands at a different hour relative to a chart set to another zone. Anything that anchors events to a fixed chart time rather than to the real release time will drift through those weeks.
The second is your chart’s own timezone, set in Tools → Options → General. Events have to be converted into whatever that is, not assumed to match it. If you have ever seen a news marker land an hour off the candle that actually moved, this is why — and it is worth checking against a known release before you rely on any tool that puts events on a chart.
How to install a news indicator
- Download the NinjaTrader news indicator — keep it zipped.
- Open the Control Center → Tools → Import → NinjaScript Add-On… and select the .zip. NinjaTrader documents the process in its import guide, and we walk through every step, error message and the update rule on our installation page.
- On a chart, right-click → Indicators…, add it, then set the instrument group and the impact level you want to see.
- Check one known release against the chart before you trust it — the timezone check above takes ten seconds and saves an hour of confusion.
Common questions
Where is the economic calendar in NinjaTrader 8?
Yes. Open the Control Center, click the New menu and choose Calendar: it lists scheduled releases with date and time, event, impact, actual, consensus and prior. There is also a News window on the same menu. What NinjaTrader does not have is any way to put those events on a chart — no news or calendar indicator, and no calendar column in the Market Analyzer.
How do I show economic news on a NinjaTrader chart?
You add a news indicator — a NinjaScript add-on that fetches an economic calendar feed and draws each release on the chart at its scheduled time, usually as a vertical line plus a panel listing the next events with a countdown.
Which news releases move ES and NQ the most?
CPI, non-farm payrolls, the PCE price index and the FOMC statement, with retail sales, GDP, PPI and ISM behind them. Most US macro data prints at 08:30 US Eastern, an hour before the cash open; the FOMC statement lands at 14:00.
Why are the news times on my chart an hour out?
Almost always daylight saving or the chart's timezone. The US, Europe and Australia change clocks on different dates, so anything anchored to a fixed chart time rather than the real release time drifts for a few weeks each year. Check a known release against the chart before relying on any news tool.
Is there a free economic calendar for NinjaTrader?
NinjaTrader’s own Calendar window is free and already there, so start with that. You only need something else if you want releases marked on the chart itself with a countdown — and then what you are choosing between is mostly whether it filters by impact, whether it groups events by the instrument you trade, and whether it handles your timezone correctly.
Can I get an alert before a news release?
That depends on the indicator rather than on NinjaTrader. A countdown to the next release is the common approach and is usually more useful than an alert, because it is visible continuously rather than firing once and being missed.
Does a news indicator slow the chart down?
It should not. The work is fetching a small calendar file periodically and drawing a handful of markers — negligible next to the indicators doing per-bar calculations. If your chart is slow, the cause is usually elsewhere.
Related guides
- What the Initial Balance is — the opening hour that an 08:30 release lands right in front of.
- Why a NinjaTrader chart lags — worth ruling out before you blame an add-on for a slow chart.
- How to add VWAP — the reference most traders watch through a news-driven move.
The honest part
A news indicator will not tell you which way the number goes, and anyone who says otherwise is selling something. What it does is remove one specific mistake: opening a position minutes before a scheduled release you had forgotten about. That mistake is expensive, it is entirely avoidable, and avoiding it is worth more than most things people put on a chart.