How to Add VWAP in NinjaTrader 8: Session and Anchored
VWAP is one of the most-watched references in the market — and the first surprise is that NinjaTrader 8 has no VWAP in its chart indicator list. Here’s where the built-in one actually lives, and how to get a proper one on your chart.
What VWAP is
VWAP stands for volume-weighted average price: the average price over a period, weighted by how much volume traded at each price. It answers one plain question — are buyers paying above or below the true average? It is one of the most widely watched references in intraday trading, and it is how many institutional desks grade their own fills, which is part of why price so often reacts to it.
That last point is the whole reason it works. A line is only support because enough people are watching it, and VWAP is watched by people filling large orders who are measured against it at the end of the day.

Does NinjaTrader 8 have a built-in VWAP?
Not on a chart, on a standard installation. This is worth being precise about, because most articles say “NinjaTrader has VWAP” and leave it there.
| Where | Does a VWAP ship? | What it gives you |
|---|---|---|
| Chart indicator list | No | The standard list runs … VWMA, Volume Counter, Volume Oscillator, Volume Profile, Volume Zones, Vortex … with no VWAP between them |
| Order Flow + suite | Yes, if you have it | A session VWAP on the chart. Order Flow + is a separate suite — whether you have it depends on your NinjaTrader license |
| Market Analyzer | Yes | A VWAP column for the grid — a number per instrument, not a line on a chart |
| Third-party indicator | Yes | A VWAP line with the anchoring and bands you choose |
The quickest way to tell what you have: right-click a chart, choose Indicators… and type vwap in the search box at the top of the list. If nothing comes back, there is no VWAP on your installation and no Order Flow group to find it in. If an Order Flow group appears, you have it and the VWAP is inside.
This is the honest answer to the question people actually type, and it is why “free VWAP indicator for NinjaTrader” is such a common search. The platform is excellent; a chart VWAP is simply not one of the indicators in the standard list.
How to add a VWAP to your chart
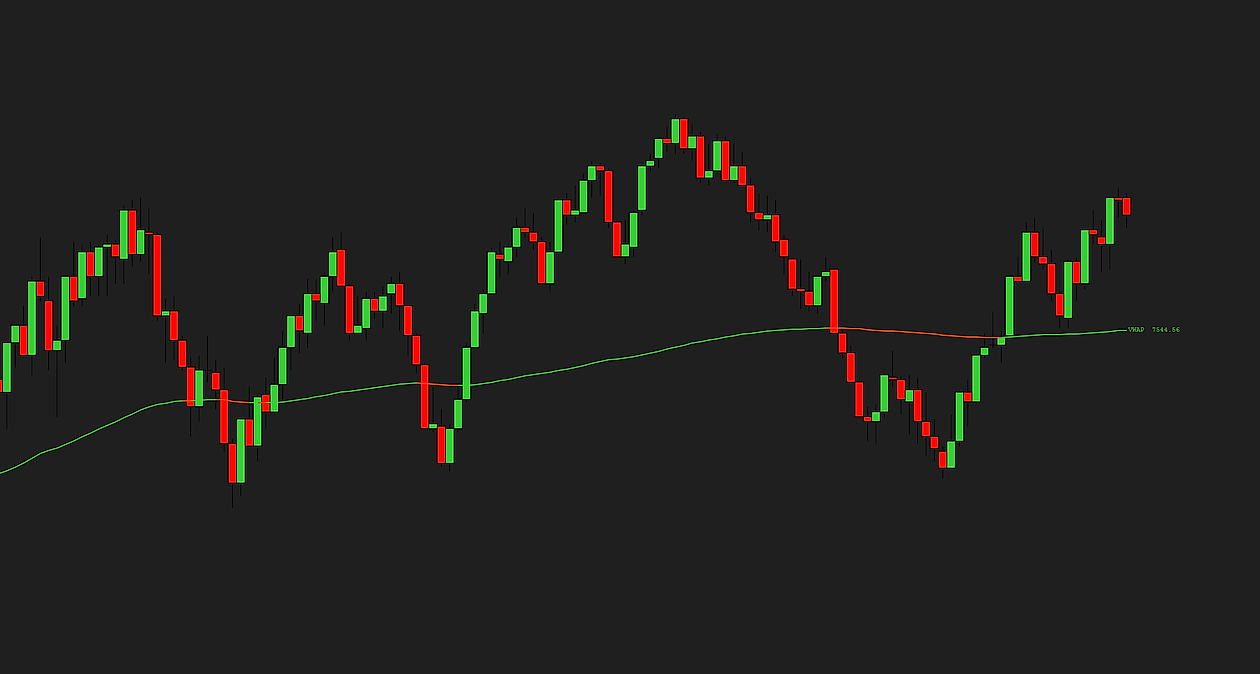
If you have Order Flow +, right-click the chart → Indicators…, find the Order Flow group, and add the VWAP. That gives you a session VWAP: it resets at the start of each session and builds through the day.
If you do not — or you want an anchor point you choose, or deviation bands you can configure — you add a dedicated VWAP indicator. It installs the ordinary way and then appears in the same indicator list alongside everything else. The steps are below.
Session VWAP vs anchored VWAP
This is the distinction that trips people up, and the two answer genuinely different questions:
| Type of VWAP | Where it starts | The question it answers |
|---|---|---|
| Session VWAP | Resets automatically at the session open | What is the average price paid today? |
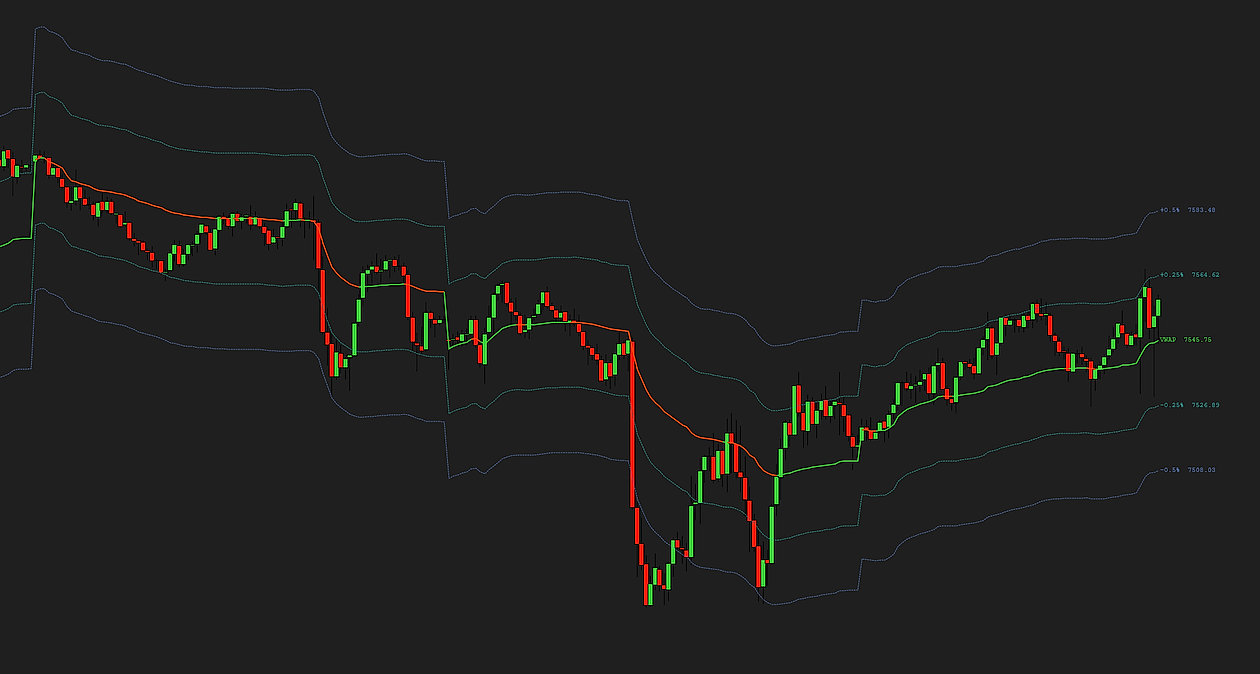
| Anchored VWAP | A bar you pick — a high, a low, a gap, a news print | What is the average price paid since that event? |
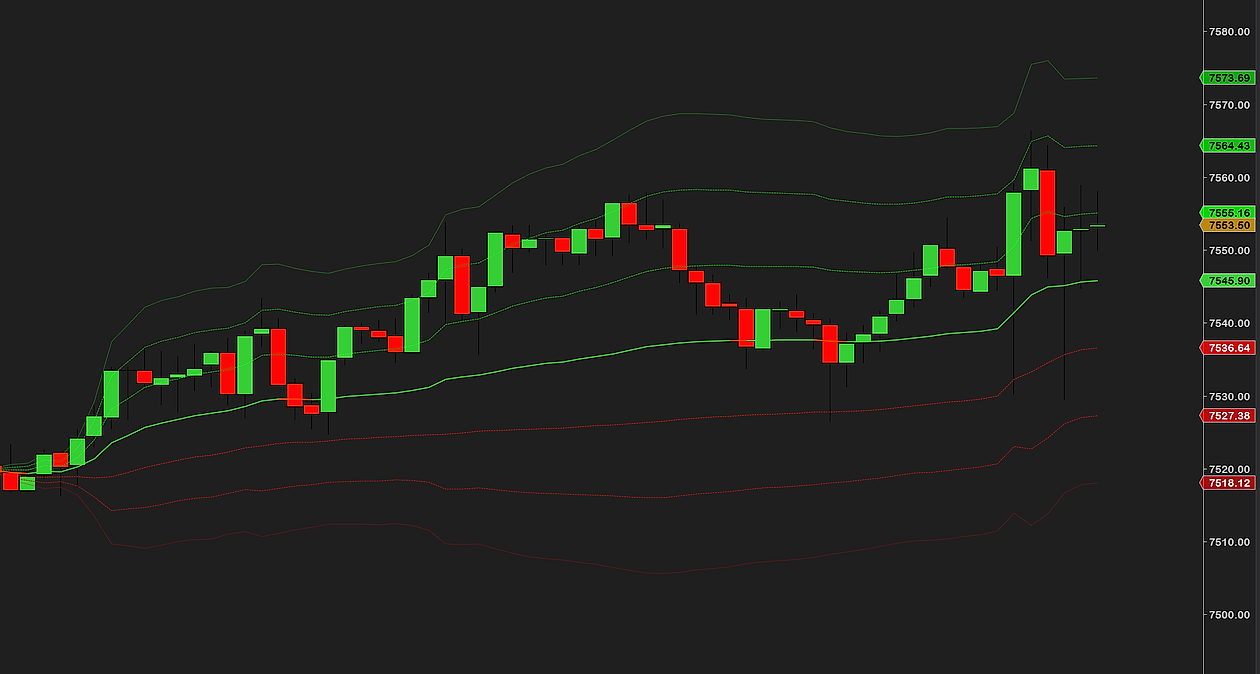
Anchoring matters because it re-frames “average price” around the moment you actually care about. Anchor to a strong low and the line shows the average price paid by everyone who bought since that low — a clean read on whether that move’s buyers are still in control. Because so many participants watch VWAP, a well-placed anchor often produces a more meaningful support or resistance line than the session default. If your NinjaTrader license has no Order Flow+, our anchored VWAP indicator for NinjaTrader 8 adds an anchored mode, weekly and monthly resets and deviation bands to any chart, with a 14-day free trial.
Where to put an anchor
An anchored VWAP is only as good as the bar you anchor it to. The useful anchors all have one thing in common: something happened there that the market agreed was important.
- A session high or low that held. The average price paid since the turn, which is what everyone who bought the bounce is sitting on.
- A gap. Anchor at the open after the gap and you are measuring the value the market has built since the repricing, ignoring everything before it.
- A news release. Anchor to the bar the number printed on. Everything before it was trading on different information.
- The first bar of the week or month. A slower reference for swing decisions, and a common one on higher timeframes.
What does not work is anchoring to an arbitrary bar because the line looks good there. If you cannot say what happened at the anchor, the line is decoration.

Reading the deviation bands
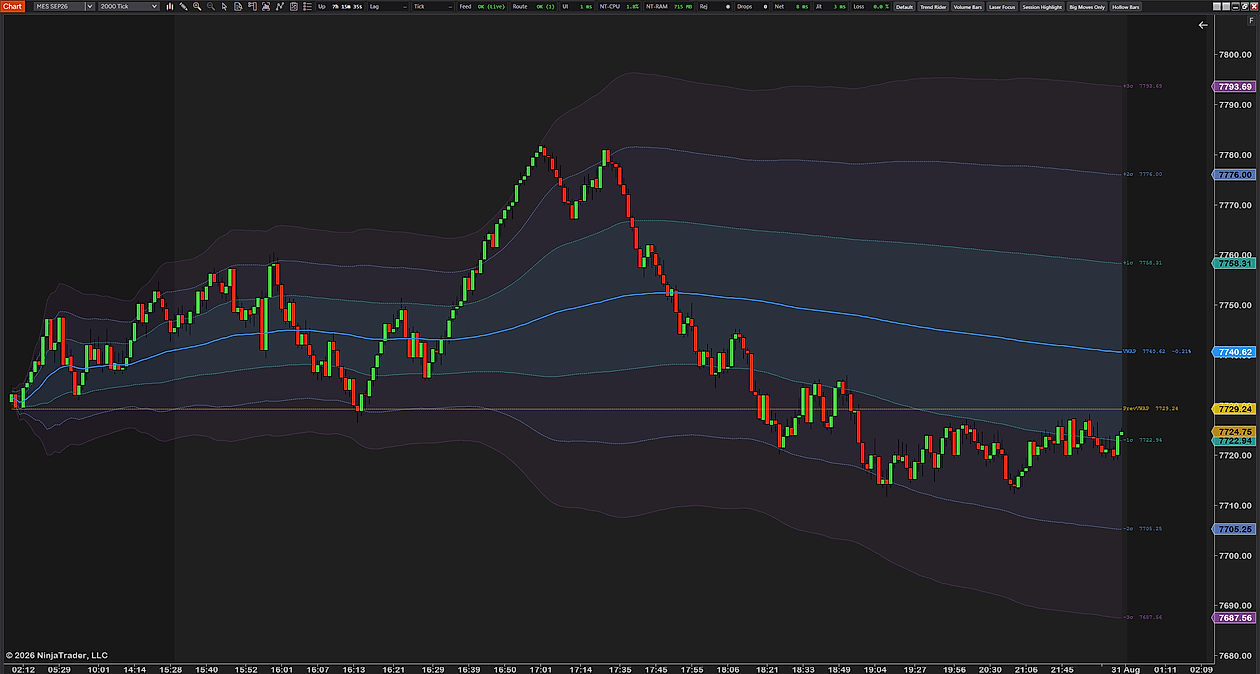
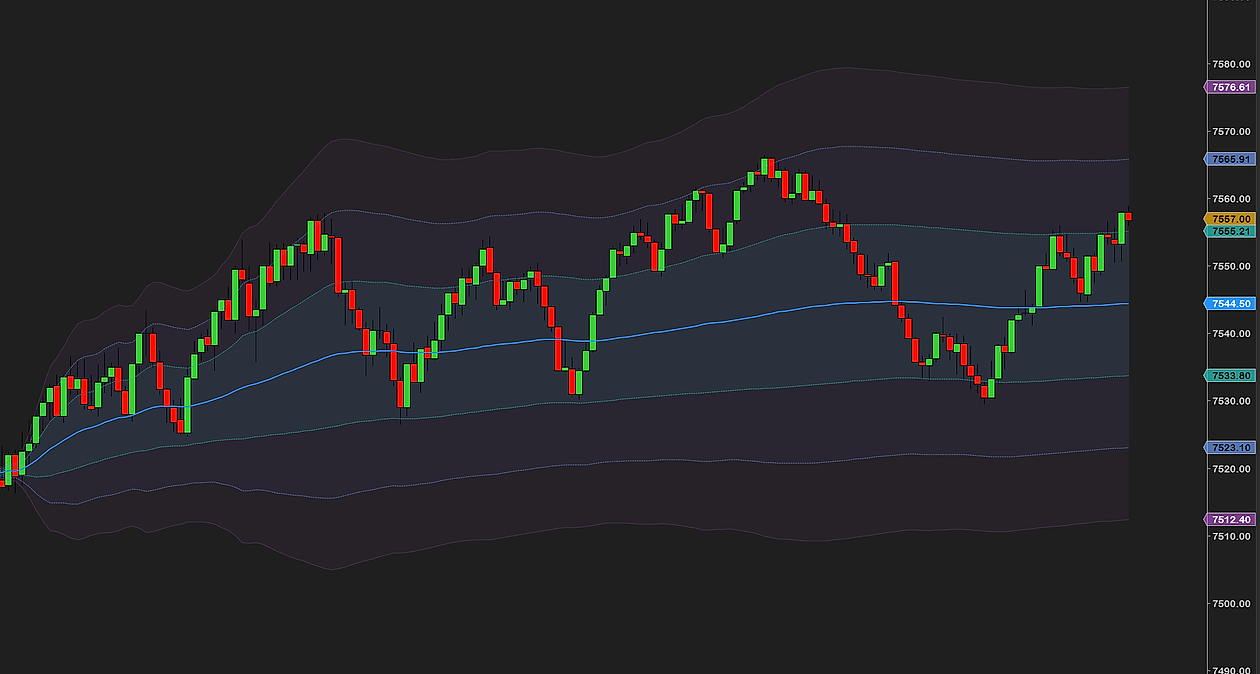
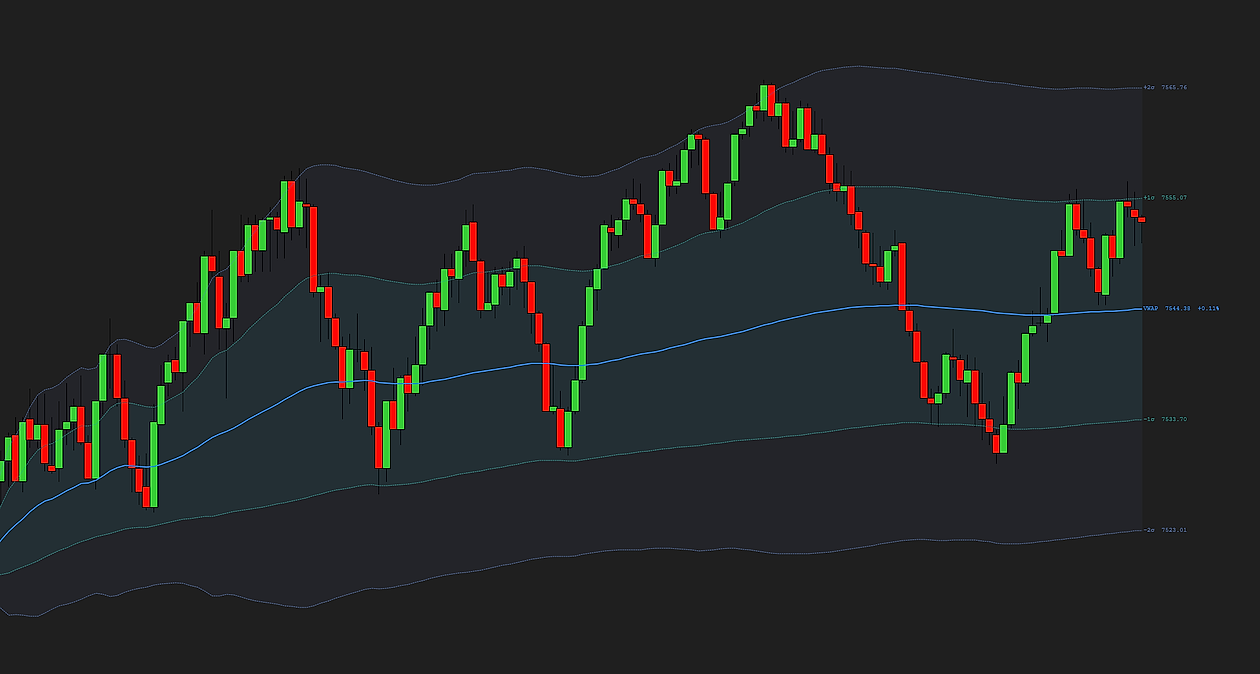
VWAP on its own is a single line. Add standard-deviation bands — usually the first and second deviation above and below — and you get context for how stretched price is:
- Price riding along VWAP or the first band in one direction is a sign of a controlled trend.
- Price pushed out to the second deviation is stretched far from the average — often where mean-reversion traders look for a fade.
- Price crossing back through VWAP is a simple read that control has shifted from buyers to sellers, or the reverse.
The bands are a measure of dispersion, not a forecast. A quiet session keeps price inside the first deviation most of the day; a trend day can ride the second band for hours without ever being “too far”. What the bands give you is a sense of whether the current distance from the average is ordinary for today or unusual.
Why two VWAPs show different numbers
Put two VWAP indicators on the same chart and you can get two different lines. That is not a bug in either one — it is what they were fed.
VWAP is a running total of price multiplied by volume, divided by total volume. The question is which price and which volume go into each step. An indicator that accumulates from every tick uses the actual traded price and size. One that accumulates from completed minute bars has to stand in for that with something like the bar’s typical price and its total volume. On a quiet bar the two agree closely. On a fast bar that covers a wide range, the typical price is a rough summary of a lot of separate trades, and the two drift apart.
Three practical consequences:
- Your line may not match your neighbor’s. Two traders on the same instrument can be looking at slightly different VWAPs.
- The session setting matters as much as the maths. A VWAP reset on a 24-hour session is a different line from one reset at the cash open, on the same data.
- Historical and live can differ if the indicator builds history from bars and then runs live from ticks.
None of this makes VWAP unreliable. It does mean that if you care about the level precisely — because you are placing orders at it — it is worth knowing what your indicator is accumulating from.
Which chart type and timeframe
VWAP is an intraday tool. Because it resets each session and weights by volume, it is meaningful on any intraday chart — time, tick, volume or range bars — and behaves the same way on all of them.
What it is not built for is daily or higher charts, where each bar is already a whole session and a session-resetting average has nothing left to reset against. An anchored VWAP is the exception: anchored to a weekly or monthly starting point it is perfectly sensible on a higher timeframe, because the anchor is doing the work the session reset normally does.
One setting to check on day one: if you trade the regular session, make sure the VWAP resets on the session you actually trade rather than a 24-hour period, or the line reflects an auction you are not watching.
Four mistakes worth avoiding
- Treating a VWAP touch as a signal. It is a reference, not a trigger. Price touches VWAP constantly on a balanced day.
- Leaving it on a 24-hour reset while trading the cash session. The commonest misconfiguration, and it quietly moves the line all day.
- Anchoring to a bar for no reason. If you cannot name the event at the anchor, the line means nothing.
- Using it on a daily chart. A session VWAP on a daily chart is a single point per bar, which is not what anybody means by VWAP.
How to install a VWAP indicator
- Download the VWAP indicator — keep it zipped.
- Open the Control Center → Tools → Import → NinjaScript Add-On… and select the .zip. NinjaTrader documents the process in its import guide, and we walk through every step, error message and the update rule on our installation page.
- On a chart, right-click → Indicators…, add it, choose session or anchored mode, and turn on the bands you want. The session itself comes from the chart’s Data Series settings.
Common questions
Does NinjaTrader 8 have a built-in VWAP?
Not in the chart indicator list on a standard installation — the list runs from VWMA straight to the Volume indicators with no VWAP among them. A session VWAP comes with Order Flow +, a separate suite whose availability depends on your license, and a VWAP column ships for the Market Analyzer grid. To check what you have, open the chart's Indicators window and search for "vwap".
Is there a free VWAP indicator for NinjaTrader 8?
Yes, third-party VWAP indicators exist, both free and paid. What you are choosing between is mostly anchoring, how the deviation bands are configured, whether the session reset matches the session you trade, and whether the calculation accumulates from ticks or from completed bars.
What is anchored VWAP?
An anchored VWAP starts from a bar you choose rather than resetting at the session open. It shows the average price paid since that moment, which makes it useful for measuring what buyers or sellers since a specific high, low, gap or news release are actually sitting on.
How do I read the VWAP deviation bands?
They measure how stretched price is from the average. Riding VWAP or the first band in one direction suggests a controlled trend; pushing out to the second deviation is unusually far from the average and is where mean-reversion traders look. The bands describe dispersion, they do not forecast.
Why does my VWAP not match someone else's?
Because VWAP depends on what it accumulates. An indicator building from every tick uses actual traded prices and sizes; one building from completed minute bars substitutes a typical price and the bar's volume. They agree on quiet bars and drift apart on fast ones. The session reset setting also changes the line.
Can I use VWAP on a daily chart?
A session VWAP, no — each daily bar is already a whole session, so there is nothing to reset against. An anchored VWAP is fine on higher timeframes, because the anchor replaces the session reset.
Does VWAP repaint?
A correctly written VWAP does not: once a bar closes, the volume and price that went into it are fixed and the line at that bar does not move. What can change is the live bar, which is still accumulating, and that is normal rather than repainting.
Related guides
- What the Initial Balance is — static opening-range levels, which pair naturally with VWAP's moving average of price.
- Previous-day high, low and the session opens — the other references the day organizes around.
- Reading trend across timeframes — useful for deciding whether a VWAP reclaim has anything behind it.
The honest part
VWAP will not tell you to buy or sell. It tells you what the average participant paid, and how far from that average price has traveled right now — and because the large orders are graded against it, it is one of the few lines on a chart that is watched for a concrete reason rather than a superstitious one. Put it on, watch how price behaves around it for a few sessions, and decide for yourself how much weight it earns.