NinjaTrader 8 Previous Day High/Low and Session Opens
The previous day’s high and low are the levels the whole market references. NinjaTrader already plots more of them than most people realize — here is exactly what ships, and what is still missing.
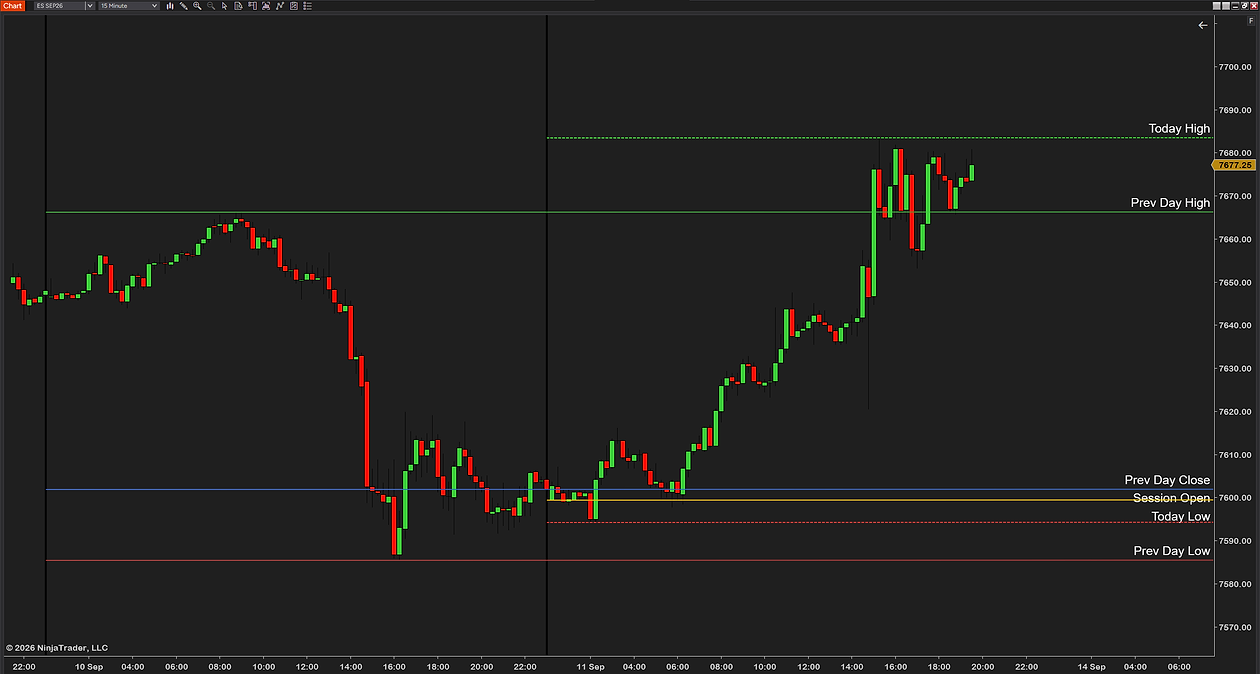
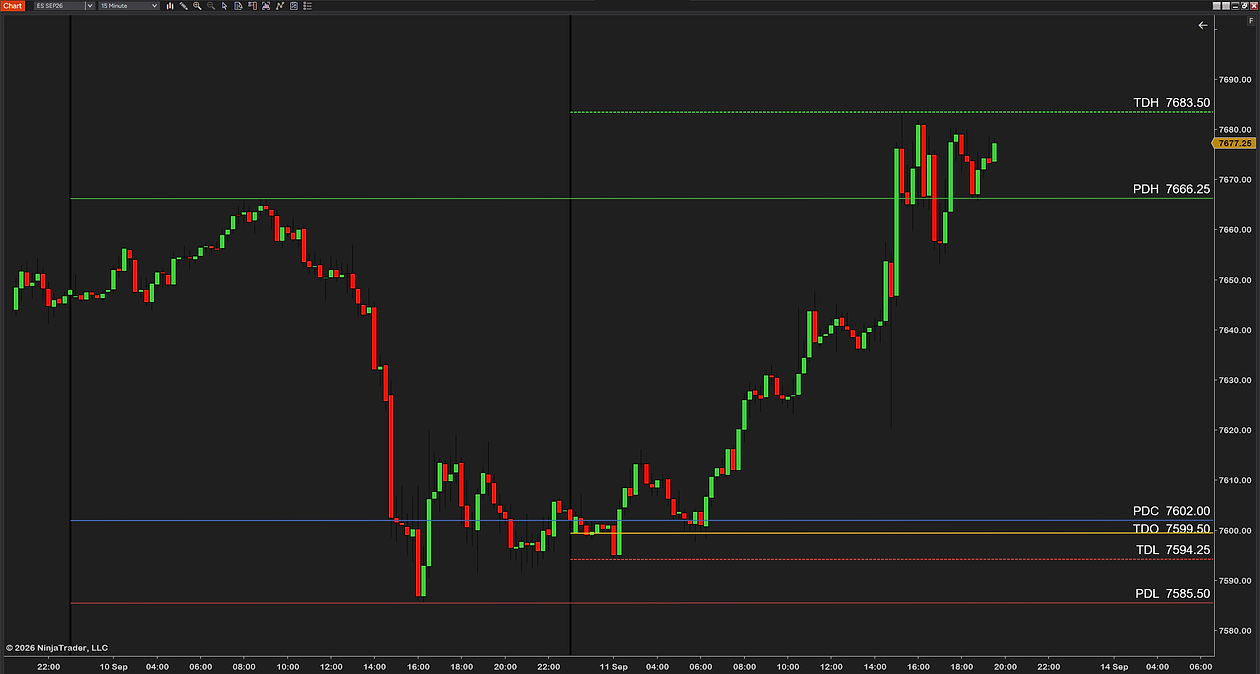
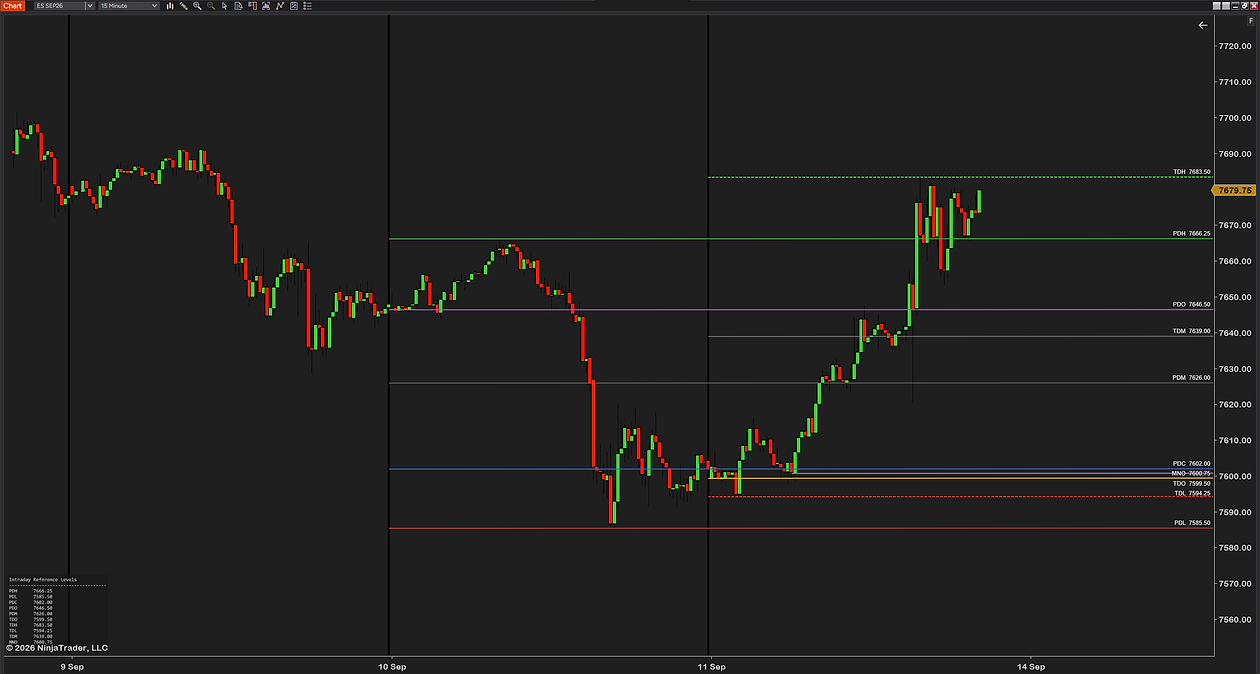
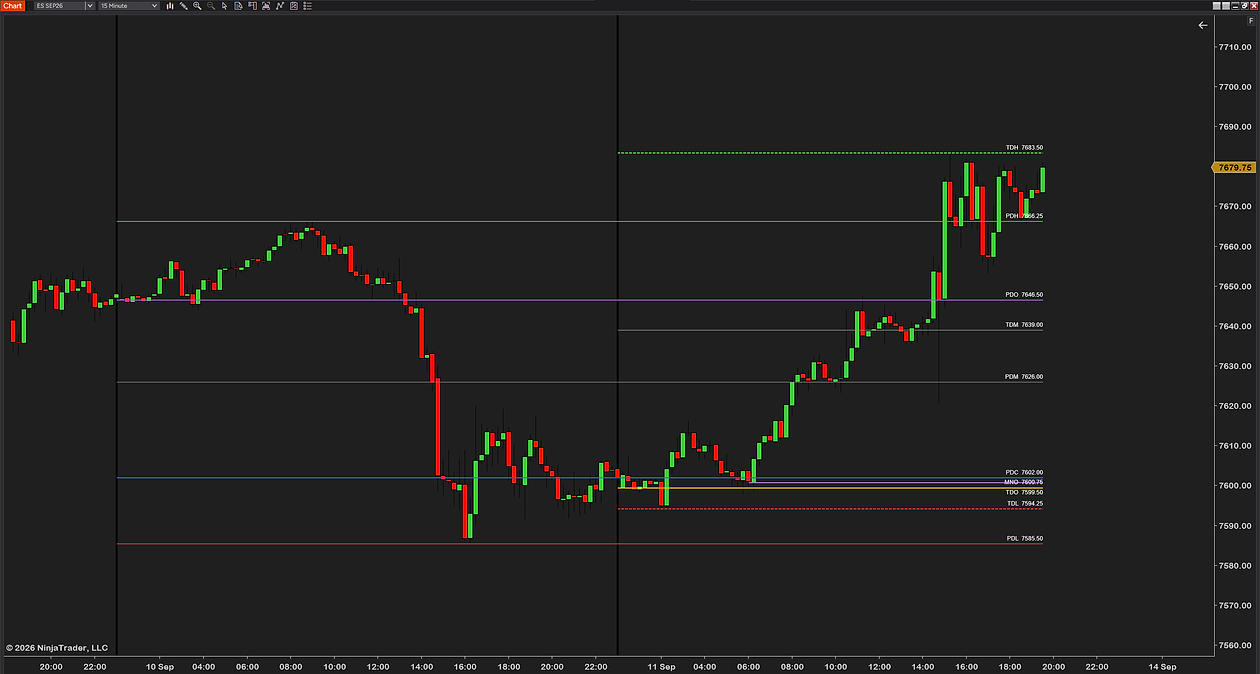
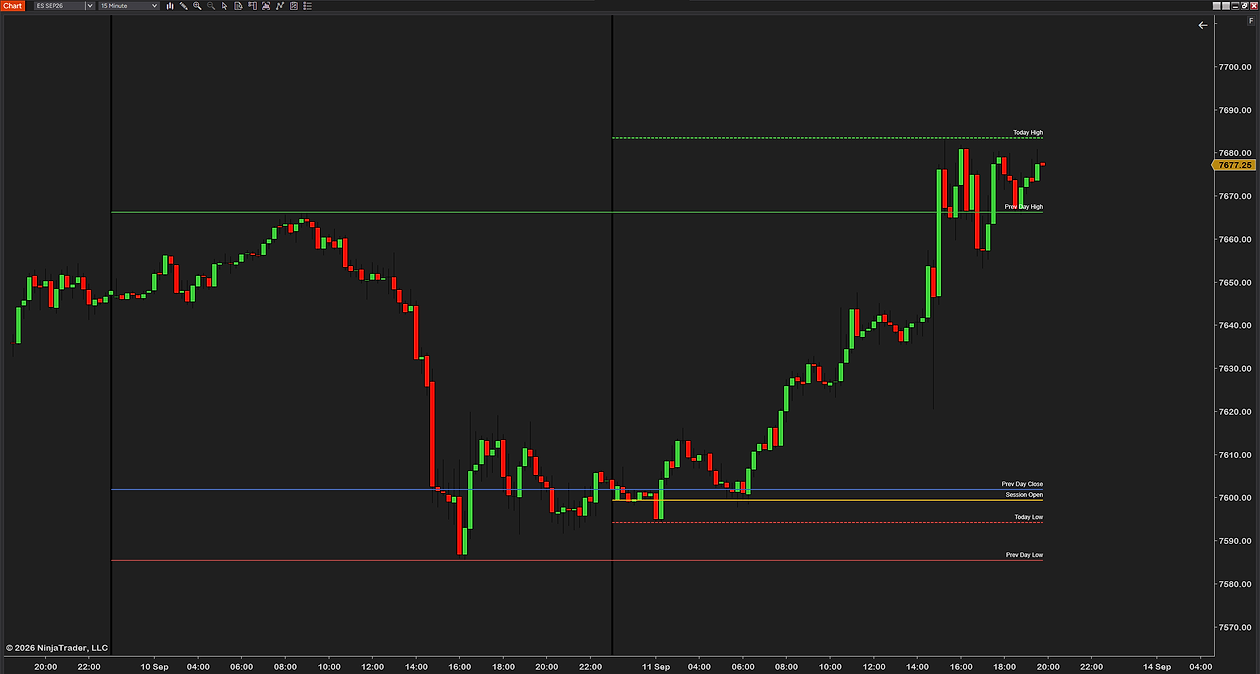
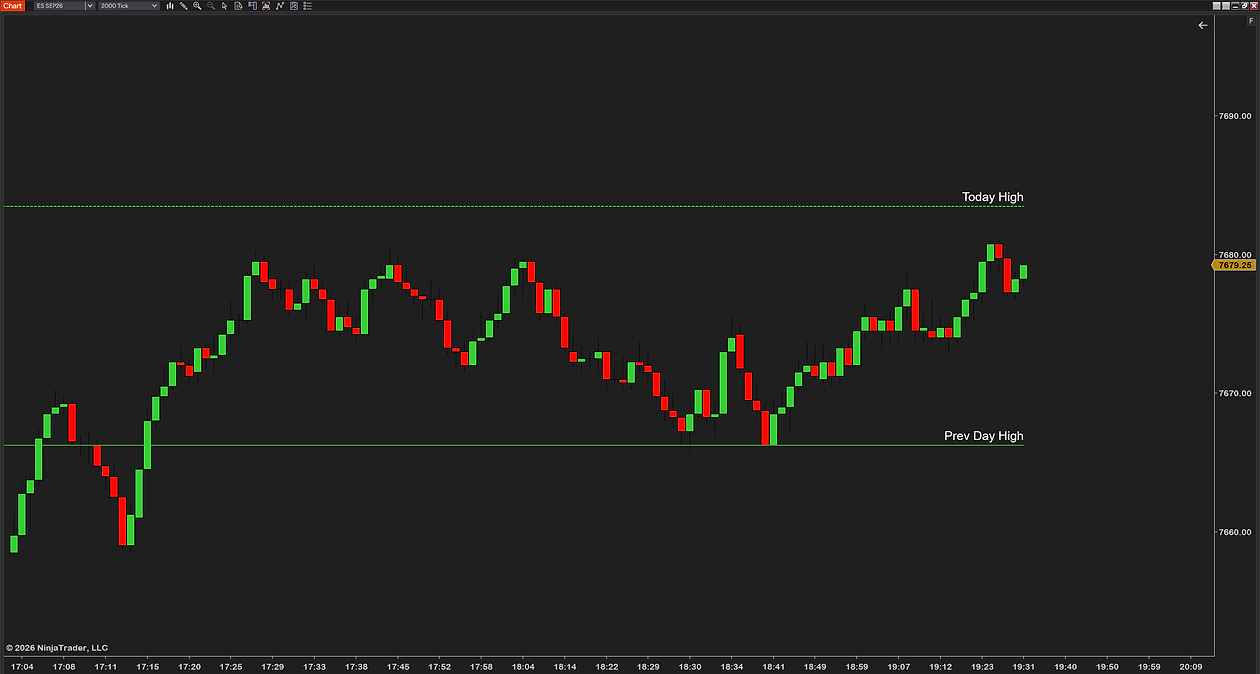
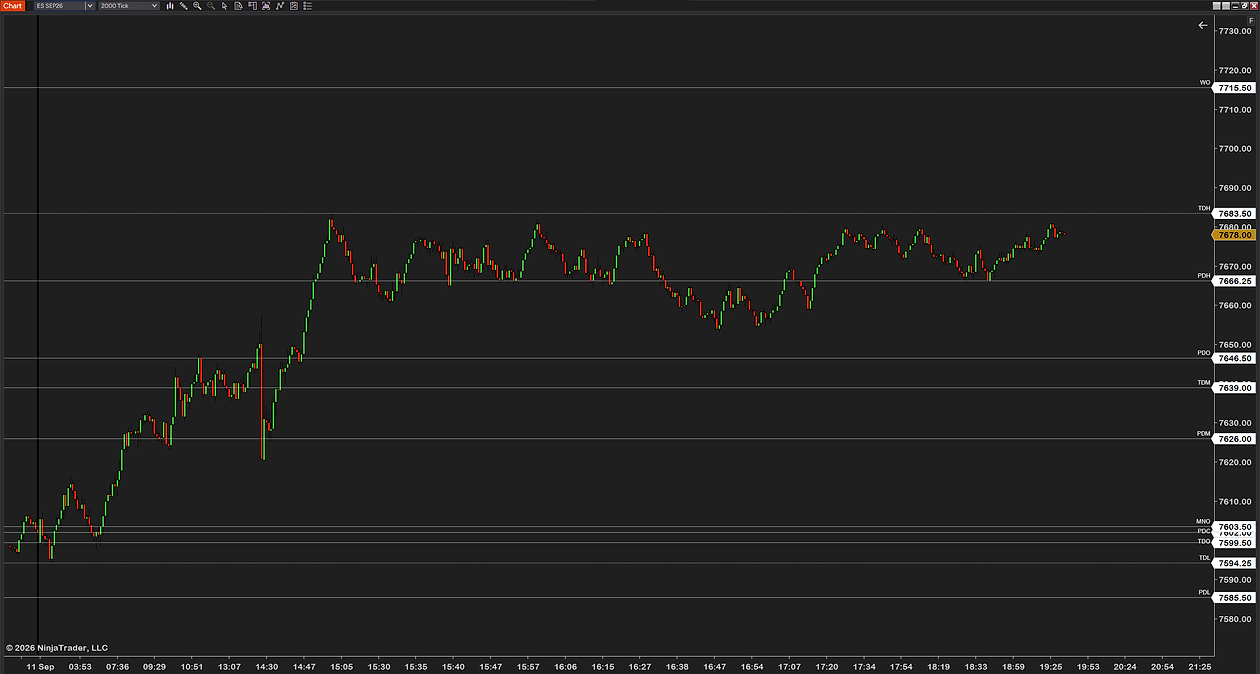
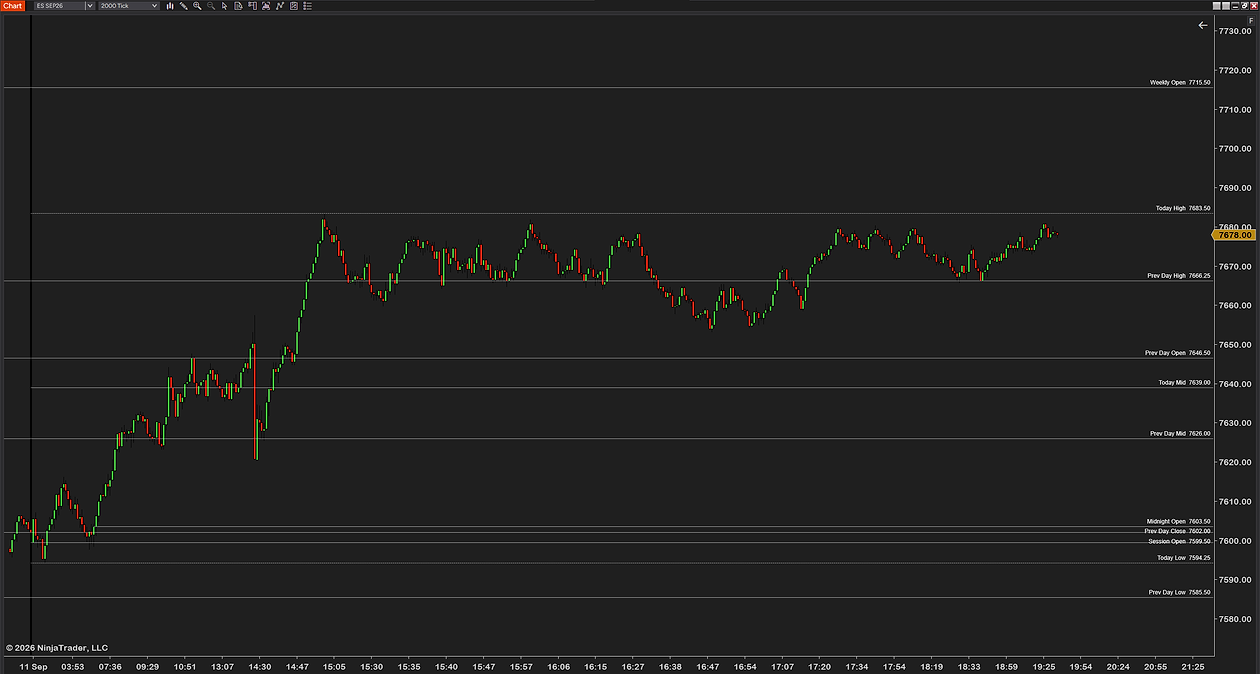
Which levels actually matter intraday
A chart can carry an unlimited number of lines and most of them are noise. The ones that earn their place have a common property: enough other people are watching them that price reacts. For index futures that is a short list.
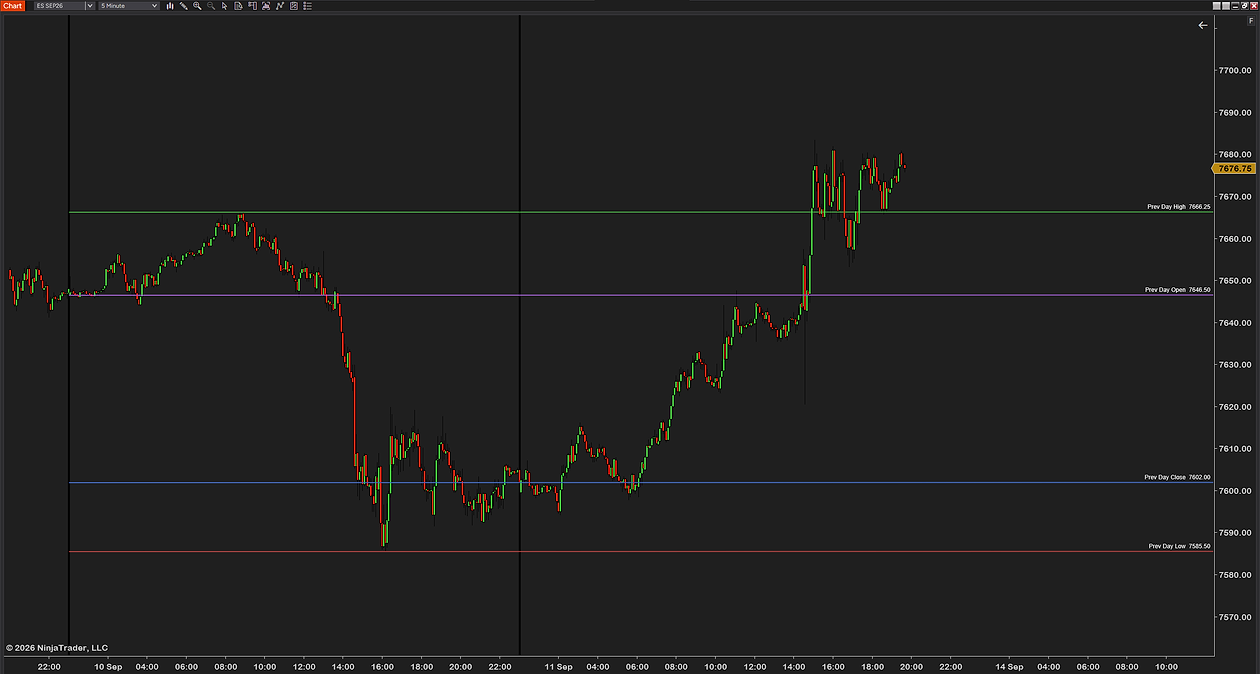
- Previous day’s high and low. The most watched pair on the chart. They mark where the last session’s auction ran out of buyers and sellers, and a break of either is the first thing most desks note.
- Previous day’s close. The reference every headline uses. “Up on the day” is measured from here.
- Today’s developing high and low. The live boundaries of the session so far.
- The session open. The regular-hours open, which for US index futures is 09:30 Eastern, and which separates the overnight auction from the one that matters.
- The midnight open. The start of the trading day, used widely enough that it behaves as a reference in its own right.
Beyond that you get into personal preference, and personal preference is where charts go to die.

The five level indicators NinjaTrader ships
This is the part most articles get wrong, usually by saying NinjaTrader plots none of this. It plots a good deal of it. Here is the complete set, described as NinjaTrader describes them.
| Indicator | What it plots |
|---|---|
| Prior Day OHLC | The previous session’s open, high, low and close. Fixed for the whole of today |
| Current Day OHL | Today’s open, high and low. The high and low update live as new extremes are made; the open is fixed at the session start |
| Pivots | Standard floor-trader pivot levels from the prior period’s high, low and close, with support and resistance projected either side |
| Camarilla Pivots | Intraday R and S levels from the prior session’s high, low and close, updating each session |
| Fibonacci Pivots | The same idea using Fibonacci ratios rather than the standard formula |
All five are in the standard indicator list. Right-click the chart, choose Indicators…, and type the name in the search box at the top.
If you only want yesterday’s high and low and today’s developing range, Prior Day OHLC plus Current Day OHL gets you there for free, and it is worth trying before you look at anything else.
What they do not cover
Three genuine gaps, and they are the reason traders end up looking further:
- No weekly or monthly levels. There is no weekly or monthly OHLC indicator in the platform. Checked against the full indicator list, not assumed.
- Only your chart’s own session. The built-ins key off the trading-hours template the chart is using. They will not give you the London open on a chart set to US regular hours, or the midnight open as a separate line.
- Five indicators, five sets of settings. Running Prior Day OHLC and Current Day OHL and a pivot set means three indicators, each with its own colors, line styles and label options. Getting them to look like one coherent set is manual work, and it comes undone every time you build a new chart.
That last one is the real friction. It is not that NinjaTrader cannot draw the levels — it is that it draws them as separate, unrelated things. A previous day high low indicator for NinjaTrader 8 that draws all eleven as one styled set, midnight open included, is what our own tool is for; the section below shows what that looks like.
Why the session opens matter on futures
This is the part that separates futures from stocks, and it is why the built-in set feels incomplete on ES or NQ.
Index futures trade nearly around the clock, so “the open” is ambiguous in a way it never is for a stock. The midnight open starts the trading day. The regular-session open at 09:30 Eastern is when the volume arrives and the day’s real auction begins. Price often spends the overnight session drifting and then reprices entirely in the first minutes after the cash open, which makes the distance between those two opens a genuinely useful read on the session’s intent.
A chart set to a regular-hours template does not know about the midnight open at all, and a chart set to 24-hour hours treats the cash open as an ordinary bar. Neither built-in indicator bridges that, which is why session opens tend to be the first thing people add.
Getting the full set on one chart
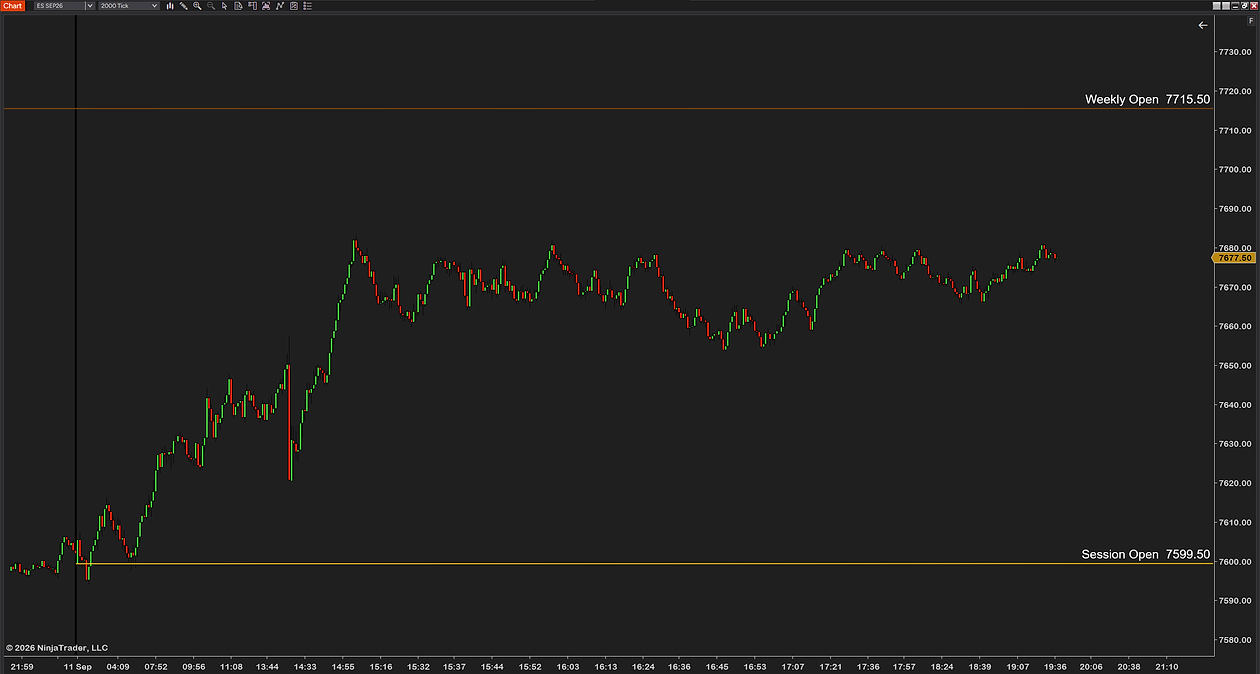
If you want the complete picture — previous-day high, low and close, today’s developing high and low, the session open, the weekly open and the midnight open — drawn once, styled together and labeled at the price, that is a single-indicator job rather than a stack of five.
What to look for: every level optional, so you show only what you use; labels at the price rather than a legend you have to decode; consistent styling across the set; and correct session handling, so the opens follow the session rather than a fixed chart time and do not drift when the clocks change.
Our own key levels indicator does that for NinjaTrader 8.

Weekly and monthly levels
Swing traders want the previous week’s and previous month’s high and low for the same reason day traders want yesterday’s: they are where the last auction of that size ended.
NinjaTrader ships nothing for this. The levels themselves are simple — the high and low of the prior week or month — but they have to come from somewhere, and on an intraday chart that means an indicator which reaches back to a higher timeframe rather than reading the bars in front of it. It is the one part of the reference-level set with no built-in answer at all.
How to install it
- Download the key levels indicator — keep the .zip zipped.
- Open the Control Center → Tools → Import → NinjaScript Add-On… and select the .zip. NinjaTrader documents the process in its import guide, and we walk through every step, error message and the update rule on our installation page.
- On a chart, right-click → Indicators…, add it, then switch off every level you do not actually use. Start with previous-day high and low and add from there.
- Check the session open against a known 09:30 bar before you trust it. The timezone check takes ten seconds and saves an hour.
Common questions
Does NinjaTrader 8 plot the previous day's high and low?
Yes. The Prior Day OHLC indicator ships with NinjaTrader and draws the previous session's open, high, low and close, fixed for the whole of today. It is in the standard indicator list — right-click the chart, choose Indicators, and search for it.
How do I show today's high and low as they develop?
Use Current Day OHL, which also ships with NinjaTrader. It plots today's open, high and low, with the high and low updating live as new extremes are made while the open stays fixed at the session start.
Does NinjaTrader have weekly or monthly high and low levels?
No. There is no weekly or monthly OHLC indicator in the platform, checked against the full built-in indicator list. Prior Day OHLC covers the previous session only, and the pivot indicators calculate from the prior period rather than plotting its high and low directly.
Can NinjaTrader show the midnight open or the London open?
Not on its own. The built-in level indicators key off whichever trading-hours template the chart is using, so they give you that session's open and nothing else. A separate session open — midnight, London, or the cash open on a 24-hour chart — needs an indicator that defines it independently of the chart's session.
What is the difference between Pivots, Camarilla and Fibonacci Pivots?
All three calculate support and resistance from the prior period's high, low and close, and differ only in the formula. Pivots uses the standard floor-trader calculation, Camarilla produces a tighter set of R and S levels aimed at intraday reaction, and Fibonacci Pivots projects the levels using Fibonacci ratios.
Which levels should I actually keep on the chart?
Previous day's high, low and close, today's developing high and low, and the session open. Those are watched widely enough that price reacts to them. Everything beyond that is preference, and more lines make a chart harder to read rather than more informative.
Why do my session levels move when the clocks change?
Because they are anchored to a fixed chart time rather than to the session. The US, Europe and Australia change clocks on different dates, so anything pinned to a clock time drifts for a few weeks each year. Levels that follow the trading-hours template do not.
Related guides
- What the Initial Balance is — the opening range that forms between the session open and the first hour's end.
- How to add VWAP — the moving reference that pairs with these static ones.
- Reading trend across timeframes — context for whether a level is likely to hold or break.
The honest part
Levels do not tell you what to do. They tell you where other people are likely to act, which is a different and more useful thing — and it is why the previous day’s high matters while your favorite custom line does not. Put the few that the whole market watches on the chart, leave the rest off, and judge them by how often price actually reacts rather than by how good the chart looks.