Back to Indicators
Buyer guarantee
Lifetime access Updates when needed Email support Instant download Secure checkout
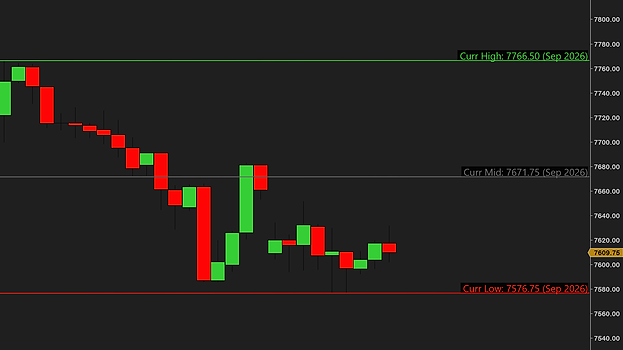
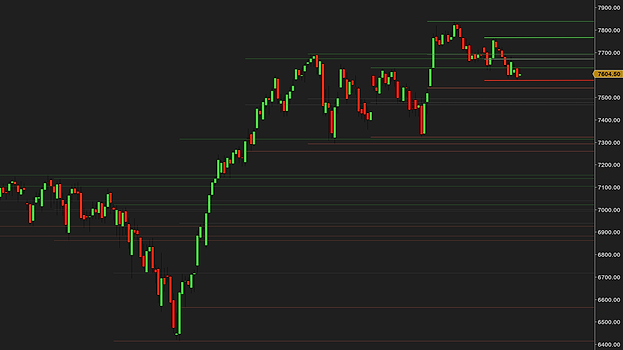
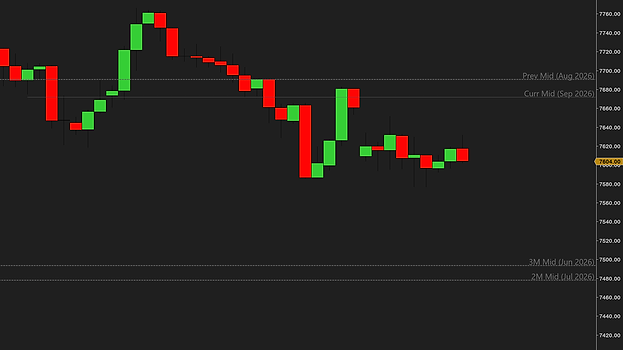
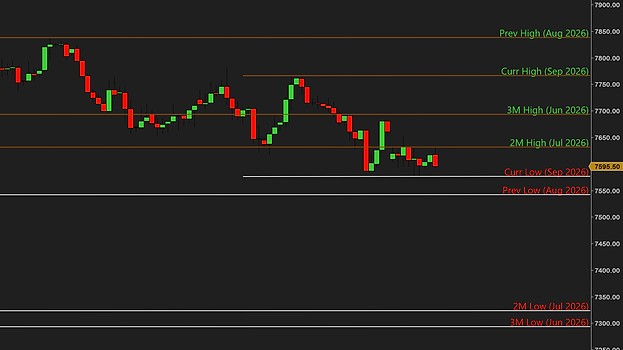
Monthly H/L Lines — previous months' high, low, mid and open levels labeled on a NinjaTrader 8 chart Monthly H/L Lines — prior-month levels extending across the chart Monthly H/L Lines — multiple months of levels with clean labels Monthly H/L Lines — monthly levels framing the current price action
1 / 4

Monthly H/L Lines

Free Download
Monthly H/L Lines version 1.0 — last updated 25 Jun 2026
Monthly H/L Lines — this month's developing high and low levels Monthly H/L Lines — older levels fading so the recent ones stand out Monthly H/L Lines — line extension to the current bar, right side or full width Monthly H/L Lines — labels showing exactly the information you choose, or none at all
Current-month H/LThis month's developing levels as they form
Fade older monthsOld levels dim, recent ones pop
Line extensionTo the bar, right side, or full both ways
Labels, your wayMonth, level, price, date — or no label at all
Levels & history
Months to show
Set how many past months plot
Current month
Show the live month's levels
Line extension
Right · both · to bar · off
Fade older months
Dim levels as they age
Open line
Optional monthly open level
Lines
Levels
High · Low · Mid · Open
Per line
Show / hide, color, width, style
Current month
Own styling for each line
Info box
On-chart box
Optional level summary
Position
Any of 4 corners
Labels
Content
Month · level name · price · date
Font
Family & size
Vertical
On · above · below the line
Horizontal
Right edge or month start
Per-level color
High · low · mid · open
Background
Optional box behind text
Confluence
Detection
Flags levels within N ticks
Note
Label shows the overlap
Compatibility & delivery
Chart types
Tick · min · volume · range · Renko
Instruments
Any — no volume required
Platform
NinjaTrader 8
License
Free — yours to keep
Updates
Free, lifetime
Version
1.0 — 25 Jun 2026
01 · Why monthly levels?

The previous month's high and low are the big-picture lines the whole market trades around. They mark where last month's move ran out of steam — the kind of level that decides whether a trend continues or reverses for weeks.

Monthly H/L Lines draws them automatically — the prior-month high, low and midpoint, the monthly open, and as many months back as you want — clean, labeled, and out of your way.

02 · What it tells you

A break of last month's high or low is a higher-timeframe expansion signal; a rejection there is a major fade. The midpoint is a fair-value pivot for the month, and the monthly open separates the bulls from the bears for the period.

When levels from different months stack on the same price, the confluence flag tells you — those are the heaviest levels on the chart.

03 · Why we built it

Higher-timeframe levels are easy to forget when you're staring at a 5-minute chart. We wanted them always on, styled to match, and labeled clearly — the macro structure sitting quietly behind your intraday trading.

It won't predict the bounce — no indicator will. What it does is make sure you're never surprised by a monthly level again. Every line, label, color and extension yours to set, any instrument, no volume needed. Free, lean, no bloat, no upsell — built by a working futures trader.

04 · How traders use it
The higher-timeframe fade

Price runs into last month's high and stalls — a level the whole market can see. Rejections there are some of the cleanest fades on any timeframe.

The break-and-go

A close beyond the prior-month high or low is expansion territory — the market accepting prices outside last month's range. Trade the retest, or trail the move with the level behind you.

The confluence level

Two or three months stacked on the same price — flagged automatically — is where the heaviest reactions happen. Mark it before the session, not after the bounce.

The monthly-open bias

Above the monthly open, the month's buyers are in control; below it, the sellers. One line that keeps your intraday trades on the right side of the bigger picture.

None of these are trade signals — they're the levels the market already watches, drawn for you. The entries, the stops and the discipline are still yours.

New to trading key levels? Read our full guide — How to plot previous-day, weekly & monthly levels →

Monthly H/L Lines is built to be set up once and left alone. Every line, label, color and extension is yours to control — nothing is hard-coded. Below is the actual settings panel: numbered groups, plain-English names, no cryptic abbreviations.

Monthly H/L Lines settings — history, line extension and the level lines
Monthly H/L Lines settings — labels, confluence detection and the info box
Install in 3 steps
1

After checkout, download the Monthly H/L Lines .zip — it's on the confirmation page, and in your email receipt.

2

In NinjaTrader 8: Tools → Import → NinjaScript Add-On, then select the .zip.

3

Right-click any chart → Indicators, add Monthly H/L Lines, and set your months, lines and labels.

The file
File
MonthlyHLLines_v1.0.zip
Size
181 KB — lean, no bloat
Format
NinjaScript add-on (.zip import)
Delivery
Instant — checkout page + email
Requirements

NinjaTrader 8 (latest version recommended)

Any instrument — no volume data required

Every chart type: tick, minute, volume, range and Renko

Any data provider — Rithmic, Kinetick, and more

What you get

Free forever — no catch, no upsell

Free updates — always current

Step-by-step installation guide

Email support from a working trader

Most traders are up and running in under a minute. Stuck on anything? Email us — we're traders too, and we answer.

Pairs well with

Complete your setup

Get Monthly H/L Lines

Prior-month high, low, midpoint and open as clean, labelled levels — free, and built by a working futures trader.

Free Download
Free forever · Free updates · Instant download · No card needed

Futures trading involves substantial risk of loss and is not suitable for every investor. Monthly H/L Lines is a charting and decision-support tool only — it is not a trade signal, recommendation, or financial advice. Past performance is not indicative of future results.