Intraday Reference Levels
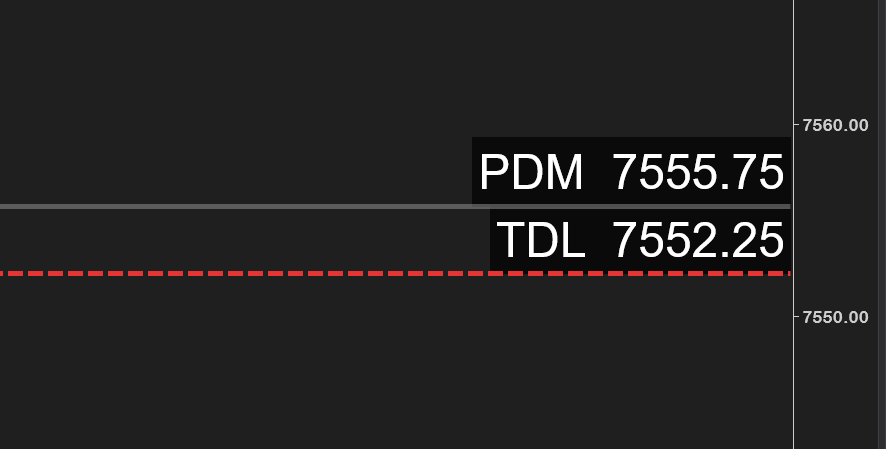
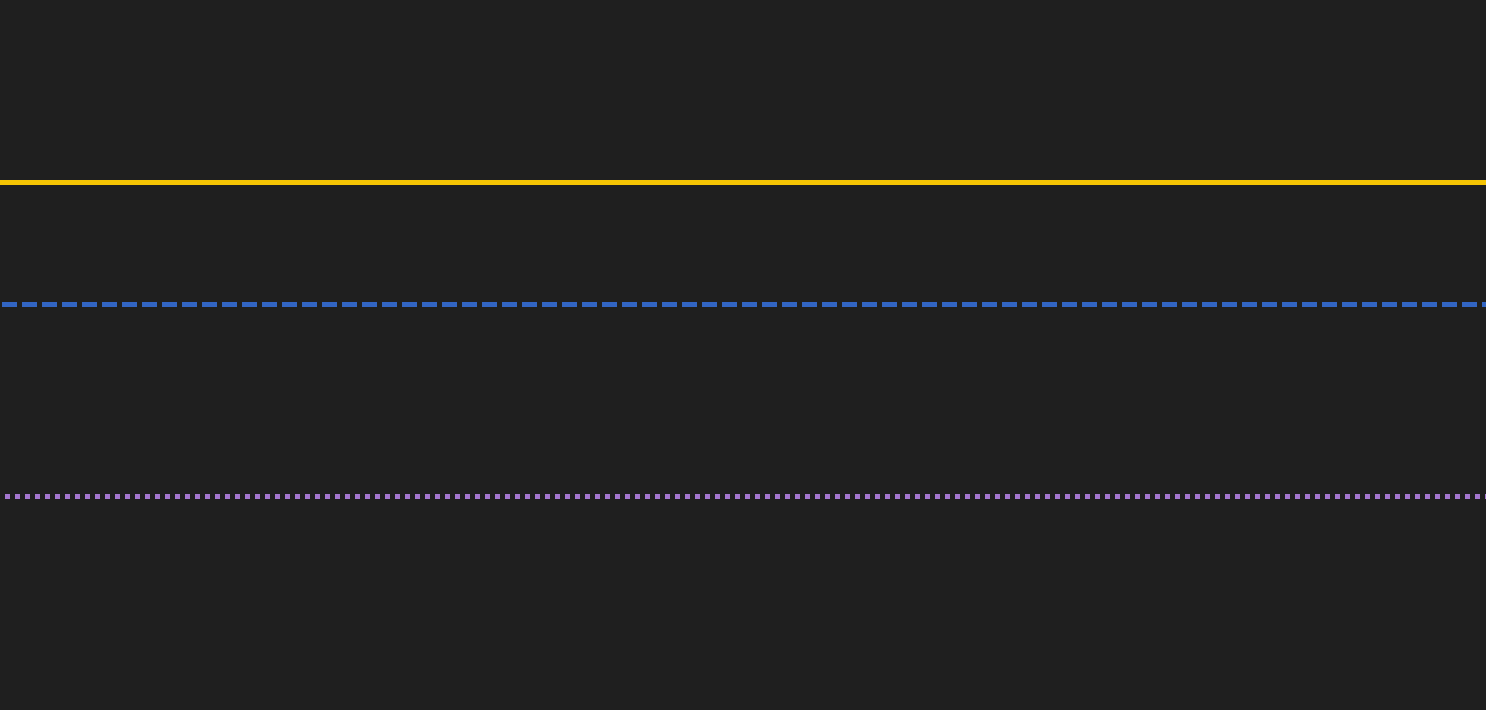
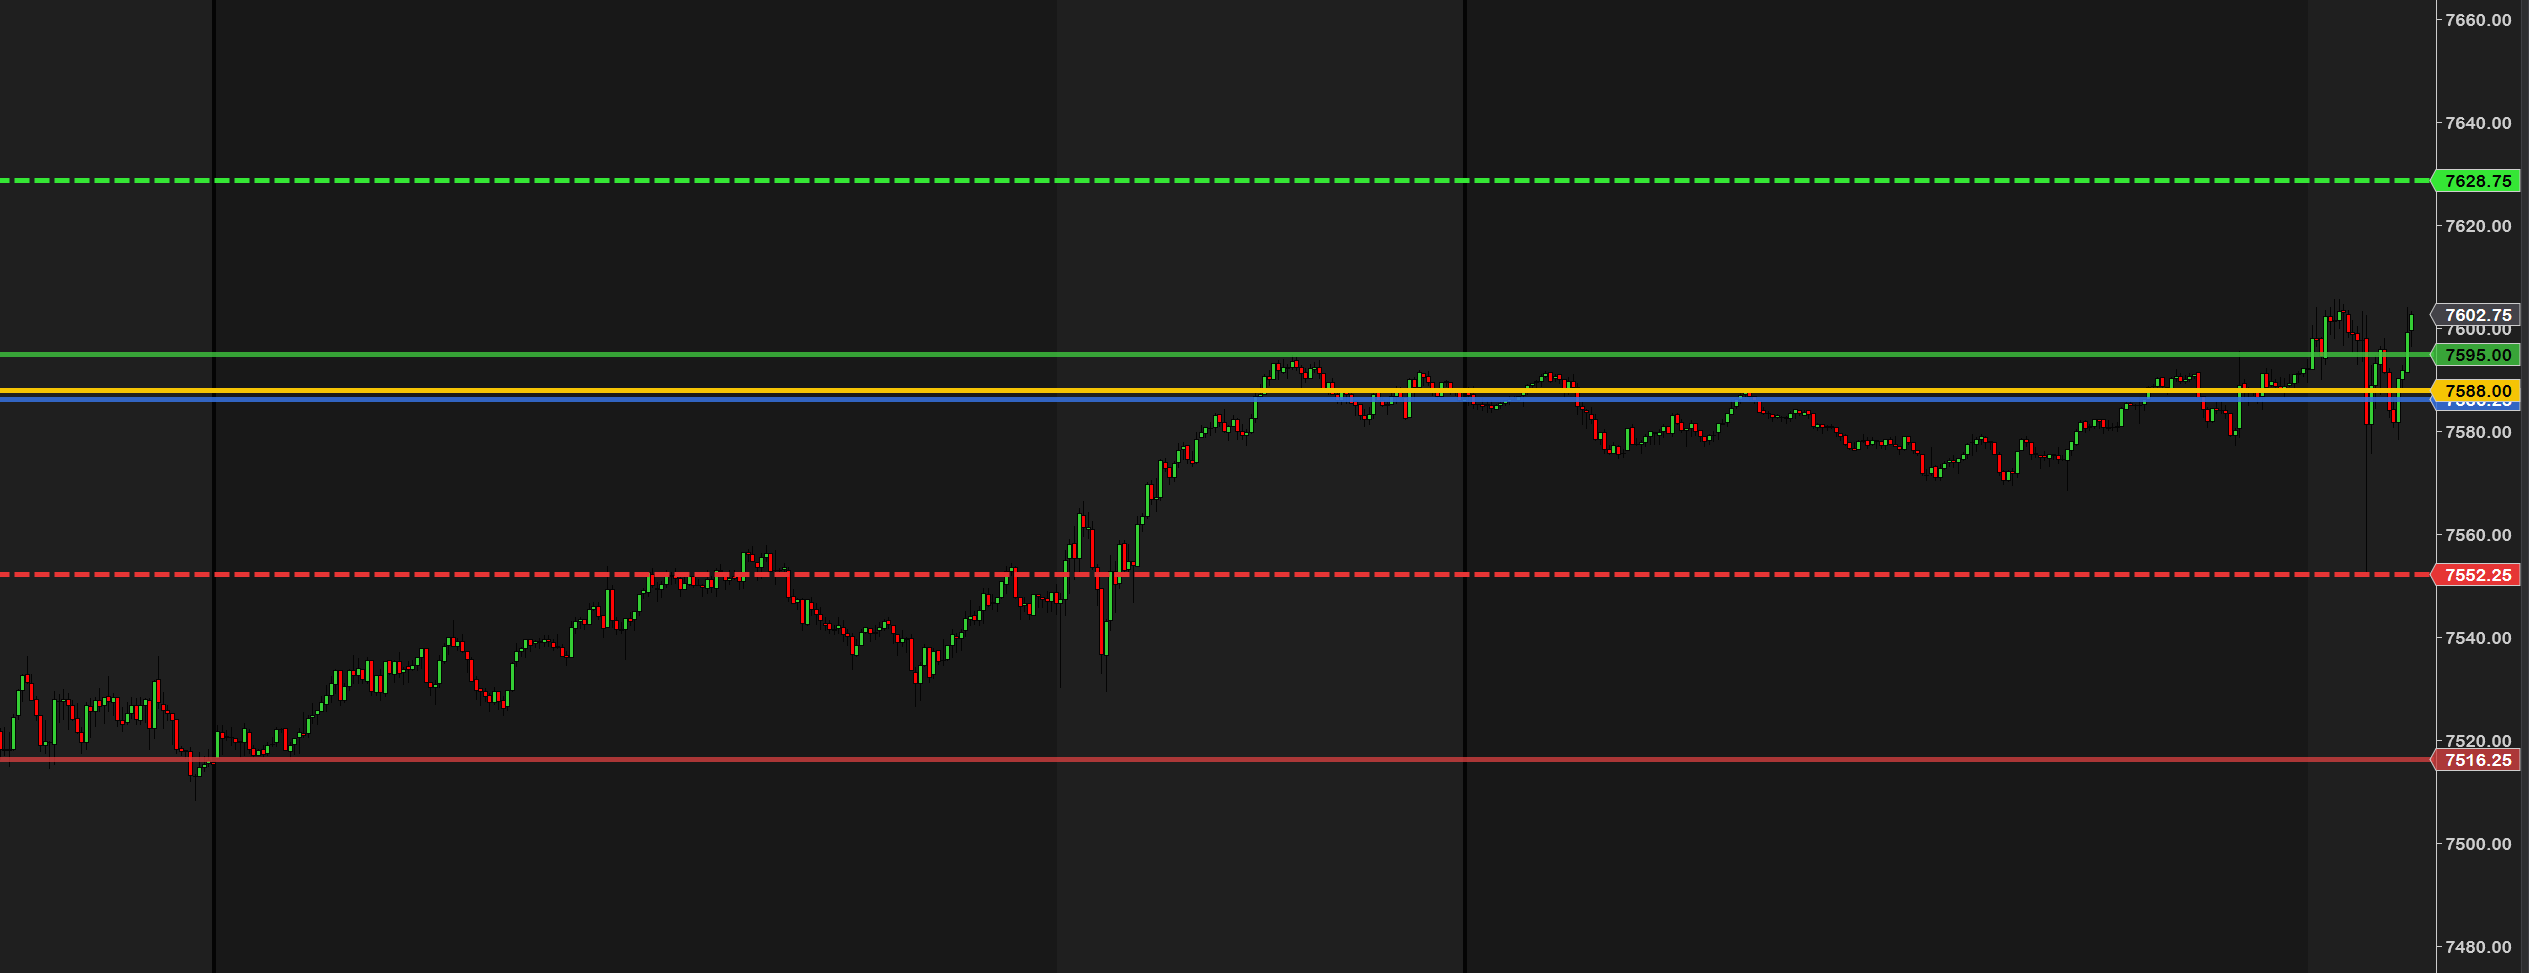
- Levels
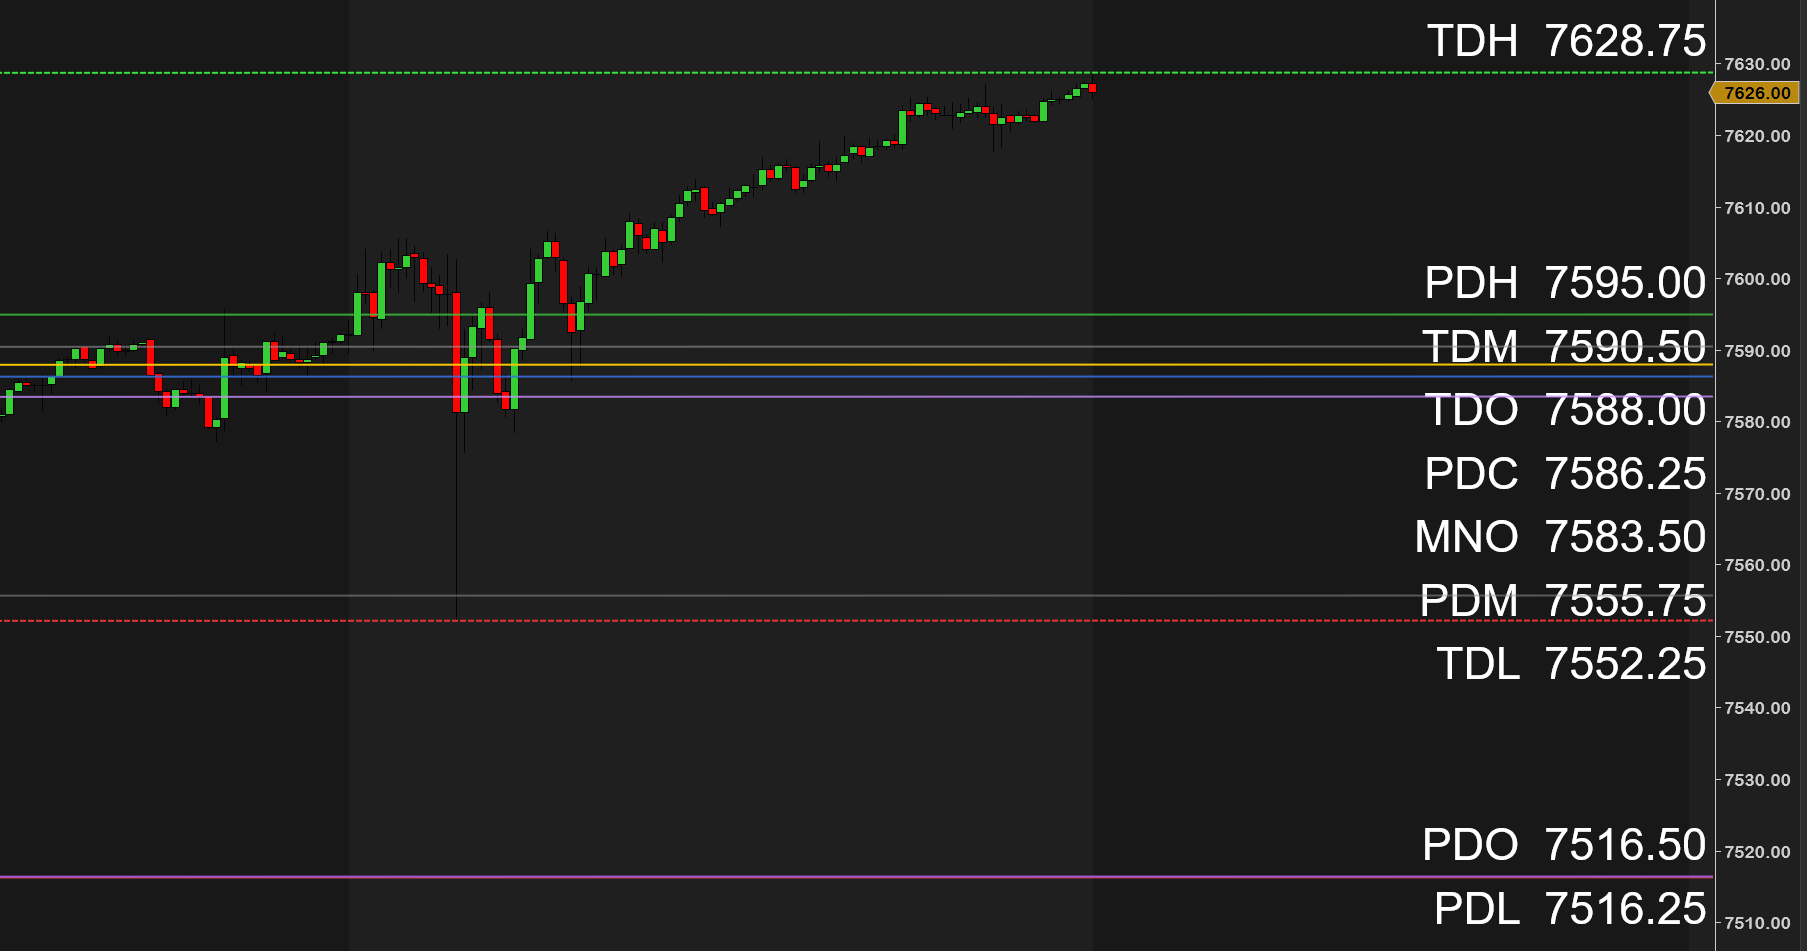
- 11 key intraday levels
- Previous day
- High · Low · Close · Open · Mid
- Today (live)
- High · Low · Mid
- Opens
- Session · Weekly · Midnight
- Per level
- Show / hide, color, style, width
- Extension
- To the right · full width · to current bar · off
- Repaint
- None — levels lock once set
- Info box
- On-chart level summary
- Position
- Any of the 4 corners
- Labels
- Per level, on / off
- Content
- Name, price or both — 5 modes
- Placement
- Above · on · below the line
- Spacing
- Auto — labels never overlap
- Label box
- Optional, with its own color
- Font & color
- Fully adjustable
- Chart types
- Tick · min · volume · range · Renko
- Instruments
- Any — futures, stocks, FX
- Timezone
- Eastern · Exchange · Local (midnight)
- Platform
- NinjaTrader 8
- License
- One-time — per purchaser
- Version
- 1.0 — 21 Jun 2026
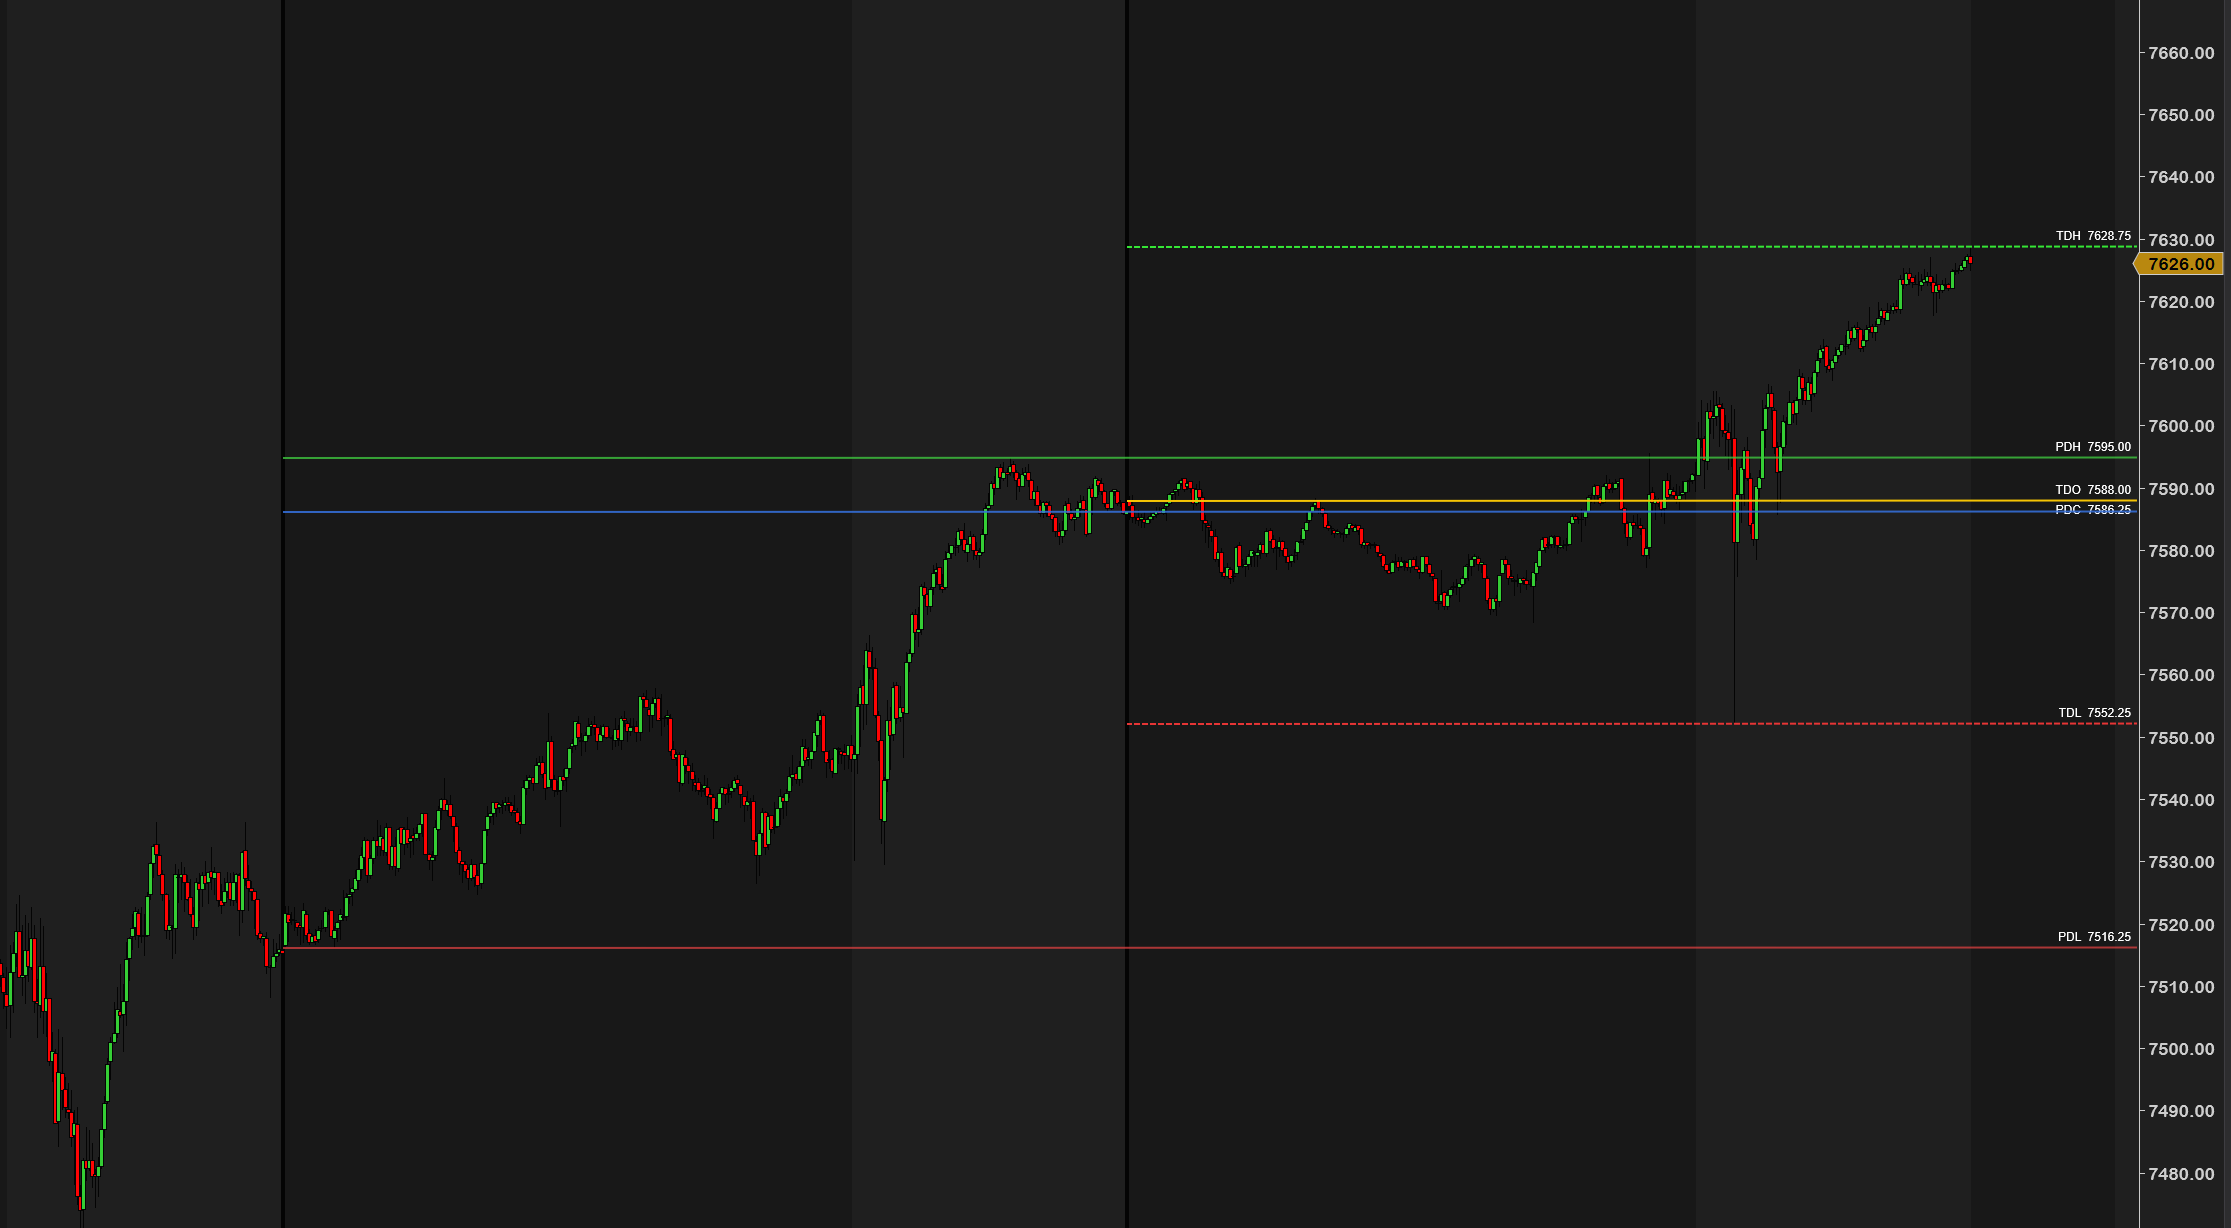
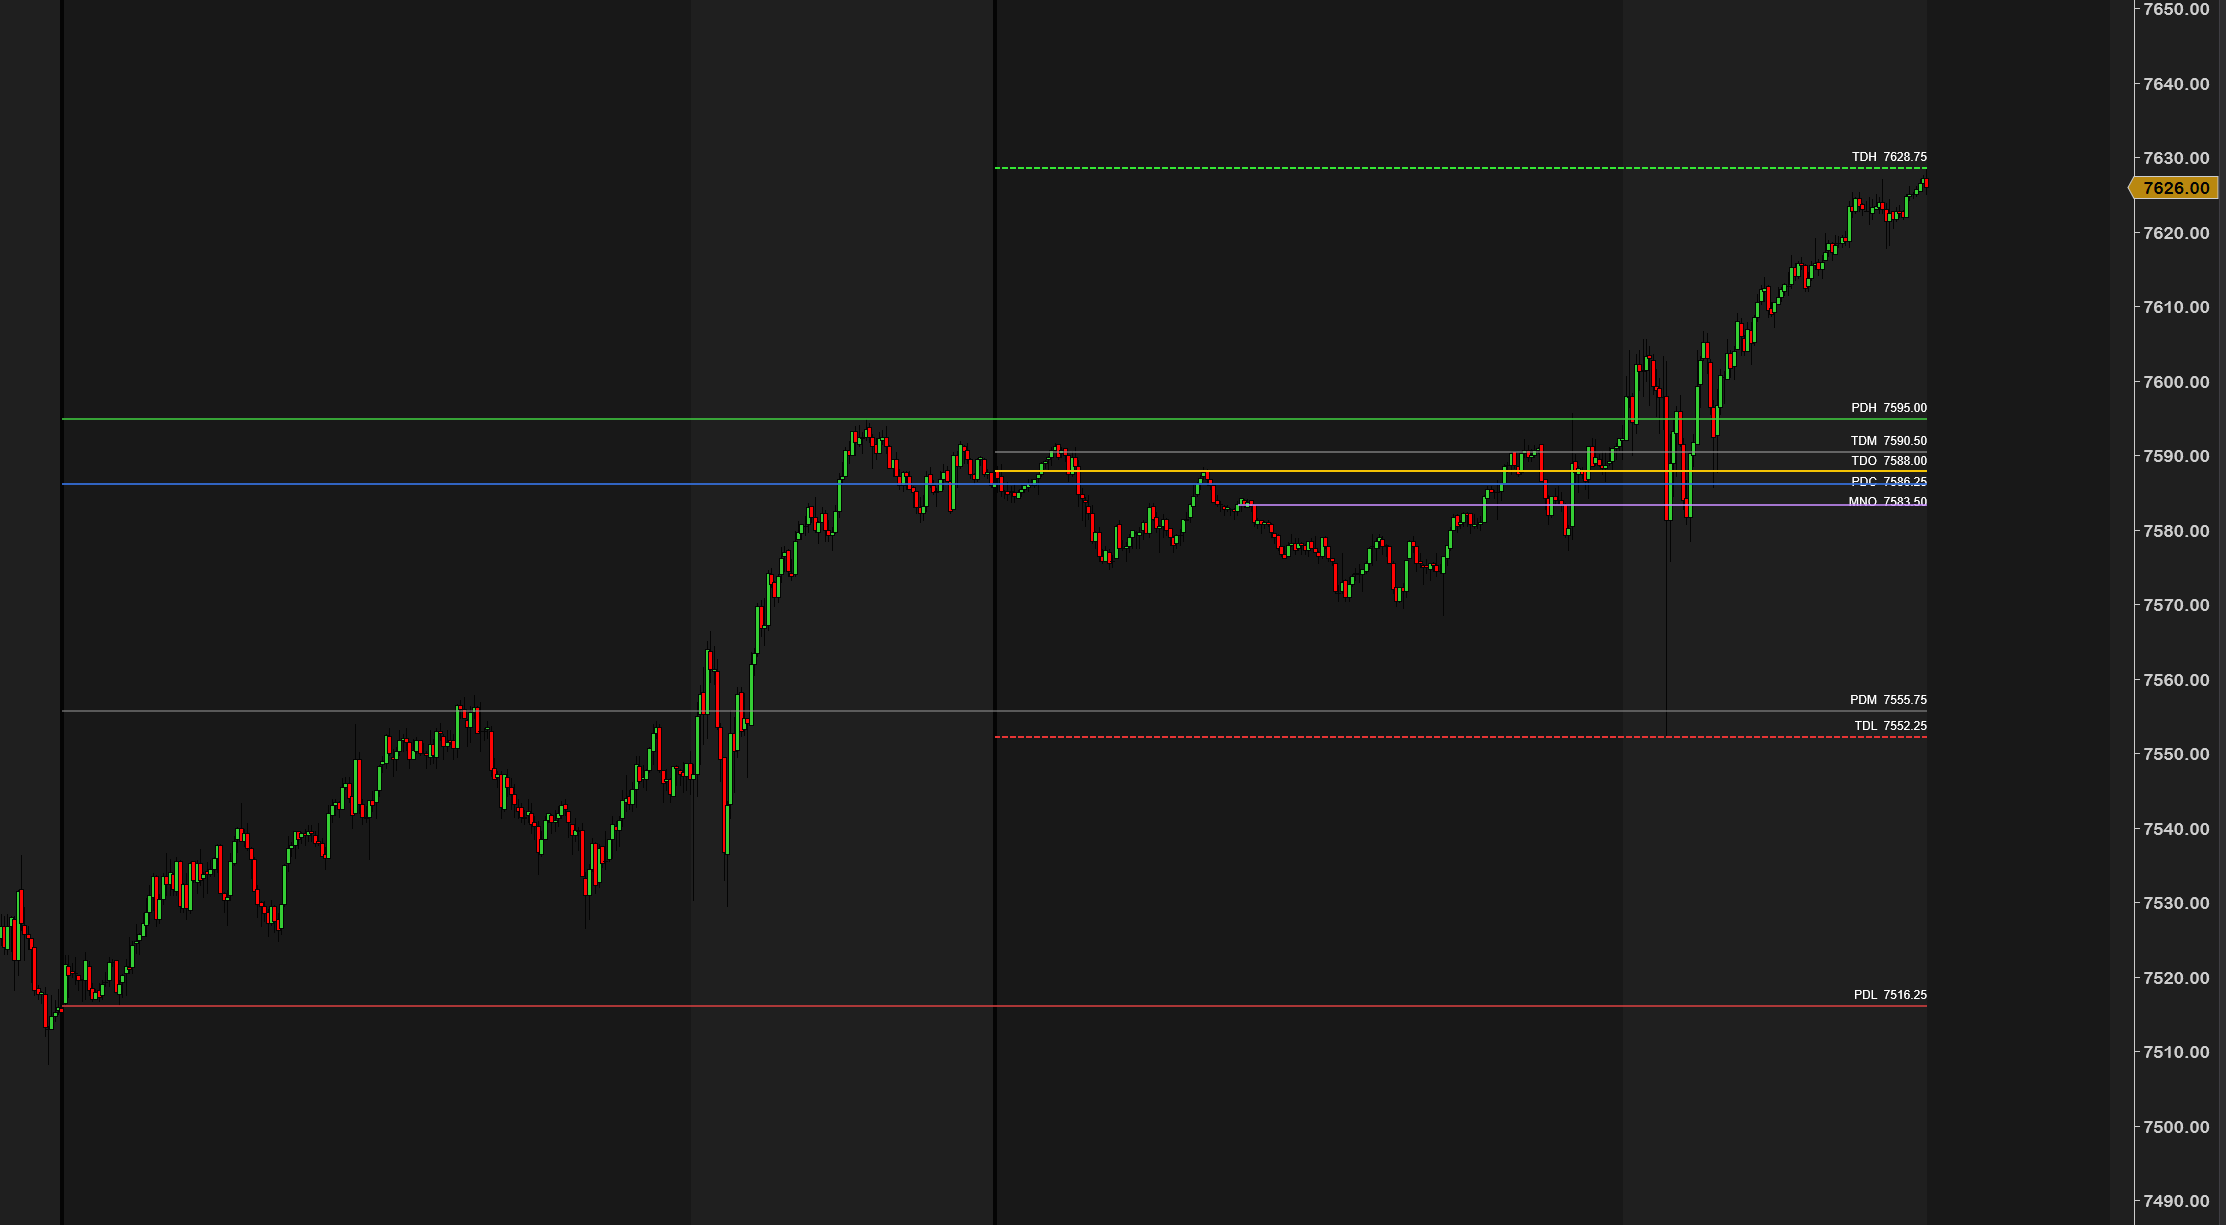
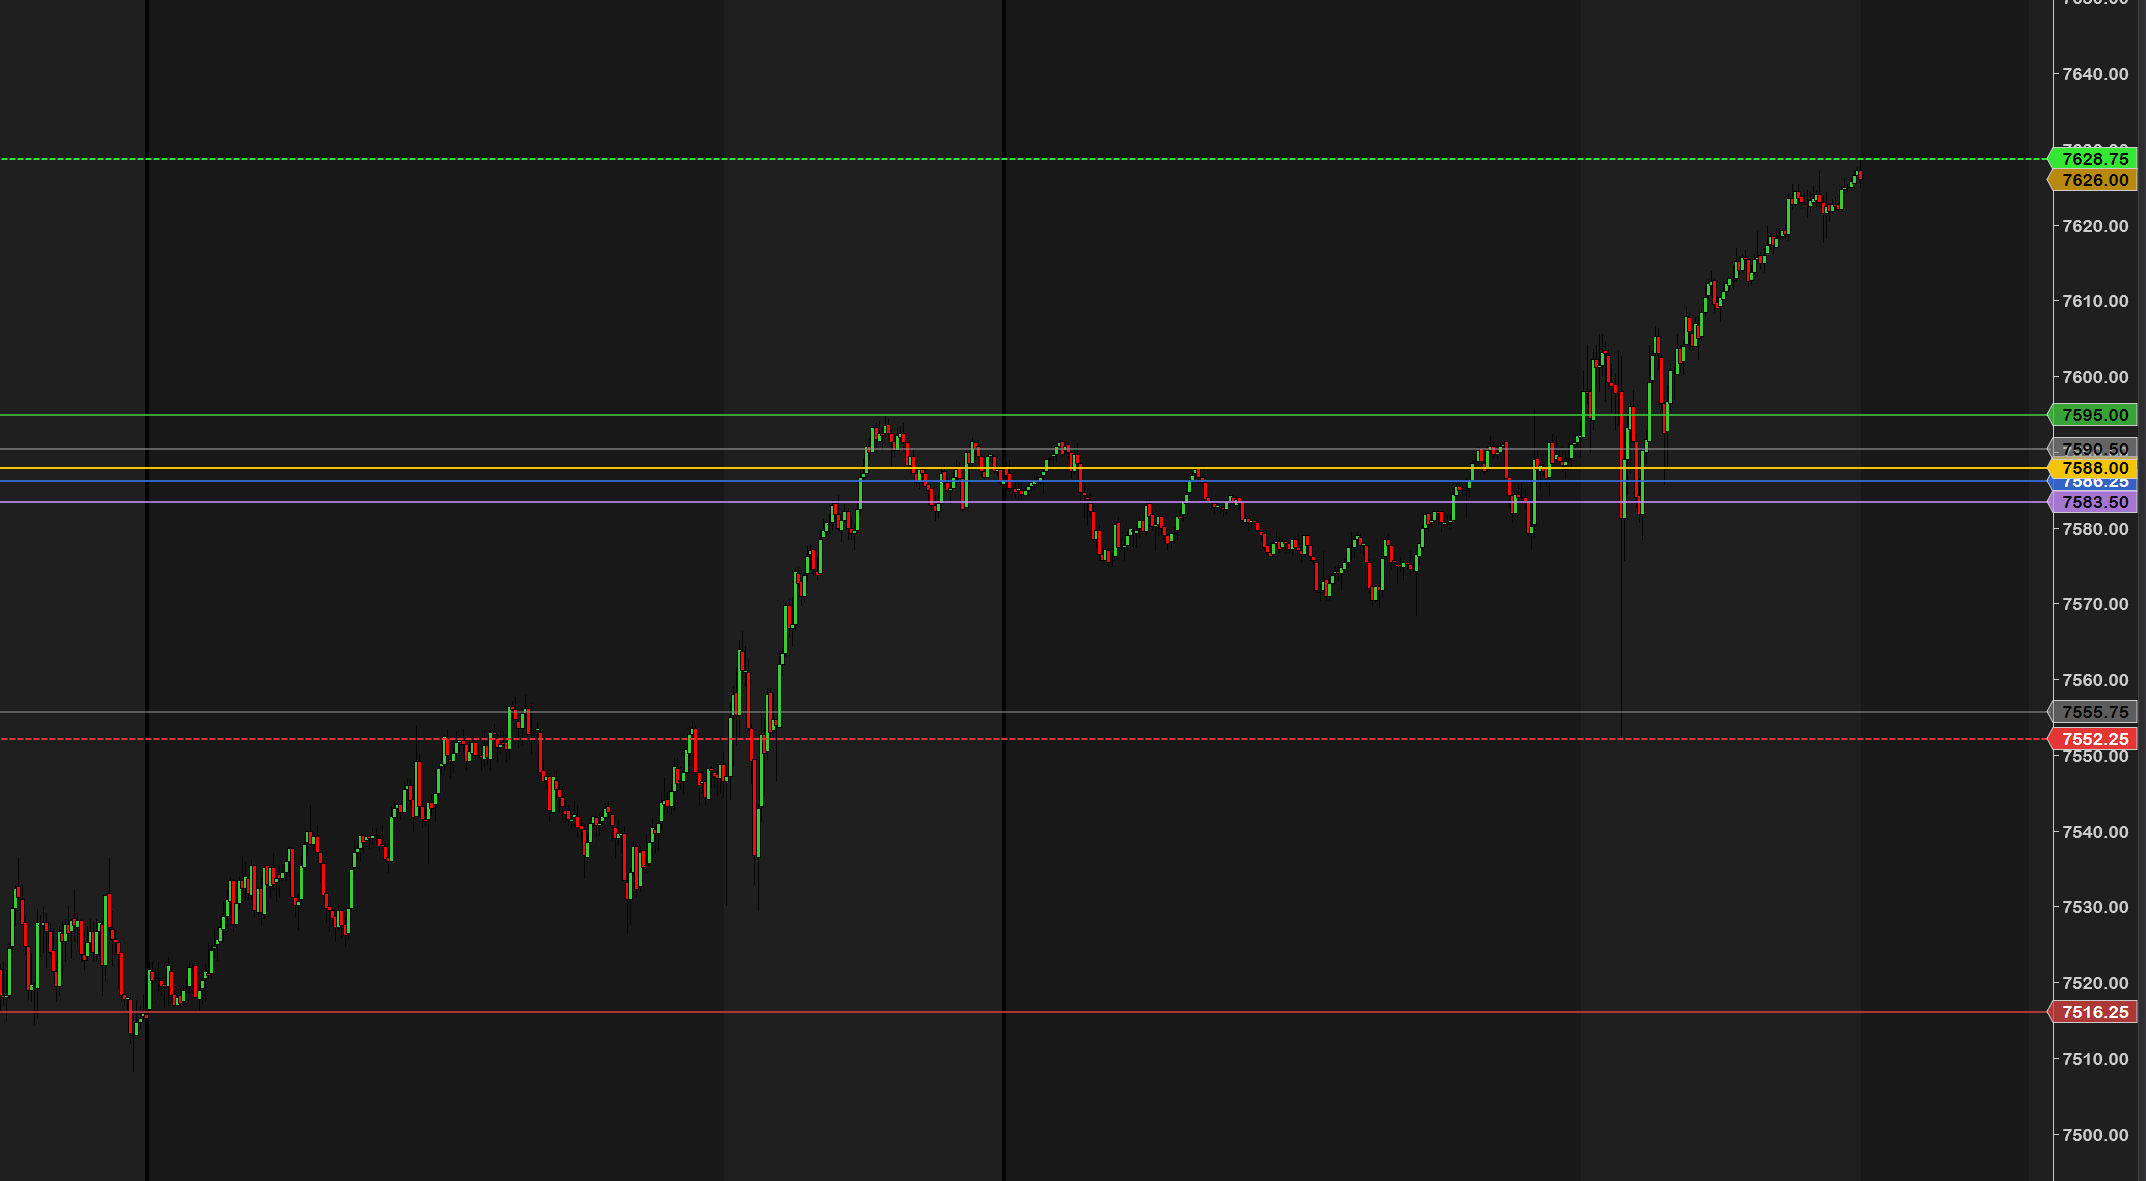
Intraday Reference Levels draws the prices the whole market trades around — automatically, the moment your session starts. Yesterday's range, the prior close, today's open, the weekly and midnight opens: the levels every desk and algorithm watches, plotted exactly where the math puts them and locked in place. Your map is ready before the bell, instead of redrawn by hand every morning.
Eleven levels, in three groups:
Previous day — High, low, close, open and midpoint of yesterday's session — the lines price measures itself against all day.
Today, live — The session open, plus a developing high, low and midpoint that update as the day trades and roll into tomorrow's previous-day levels at the close.
The opens — A weekly open anchored to the Sunday futures reopen (not a naive Monday midnight), and a true New York midnight open for daily bias.
Most level tools give you three or four lines and quietly get the details wrong. We built the opposite:
No repaint — a level shown on a past bar stays exactly where it was.
Never fabricates — if it can't know a level for certain, it leaves it off rather than draw a wrong one.
Correct by default — a true New York midnight open, and a weekly open anchored to the Sunday futures reopen.
Always readable — labels auto-space so they never overlap, however tightly levels cluster.
Yours to style — set the color, thickness, opacity and reach of every line.
Built and traded on a live ES chart every session — not guessed at by a coder.
Open the chart and the session is already framed: yesterday's high, low and close, today's open, the midnight open. First read of the morning — where the fades, breaks and targets live today.
Yesterday's high and low are the most-watched lines in day trading. A rejection there is a classic fade; a clean break and hold is expansion — either way, the level was on your chart before it happened.
Above the true New York midnight open, the day leans long; below it, short. One line that keeps your intraday trades on the right side of the daily auction.
Today's midpoint updates live as the session trades — a natural intraday pivot for mean-reversion entries and for judging which half of the day's range you're trading in.
None of these are trade signals — they're the levels the market already watches, drawn correctly. The entries, the stops and the discipline are still yours.
New to trading key levels? Read our full guide — How to plot previous-day high, low & key levels →
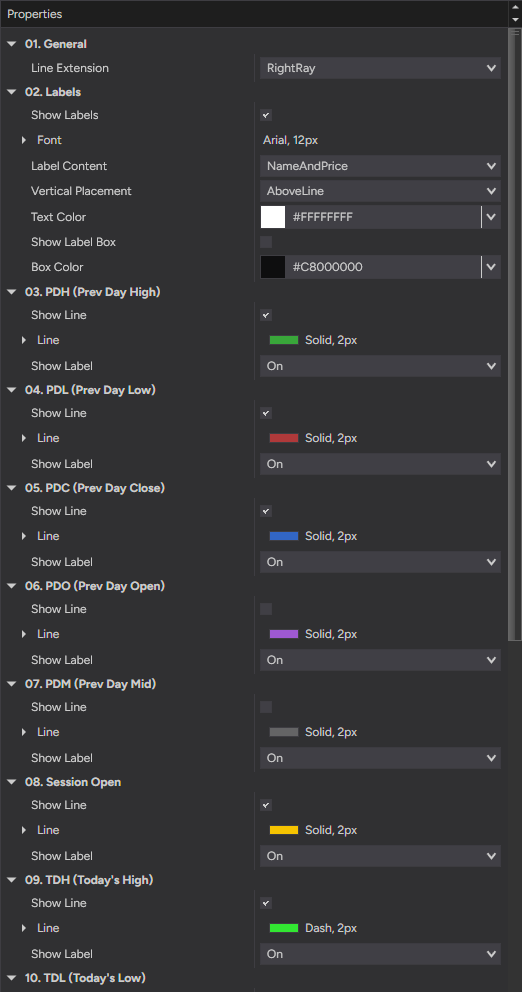
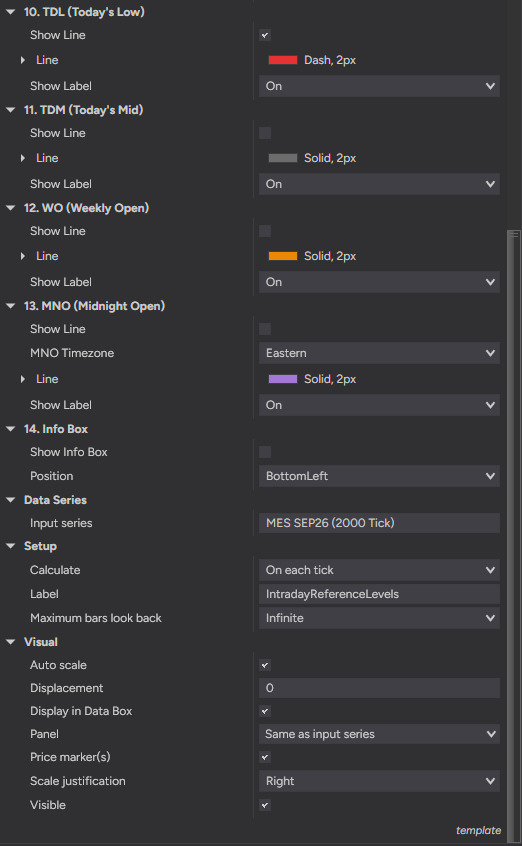
Intraday Reference Levels is built to be set up once and left alone. Every one of the 11 levels has its own line, label and color controls — nothing is hard-coded. Below is the actual settings panel: numbered groups, plain-English names, no cryptic abbreviations.
After checkout, download the Intraday Reference Levels .zip — it's on the confirmation page, and in your email receipt.
In NinjaTrader 8: Tools → Import → NinjaScript Add-On, then select the .zip.
Right-click any chart → Indicators, add Intraday Reference Levels, and toggle the levels you want.
- File
- IntradayReferenceLevels_v1.0.zip
- Size
- 181 KB — lean, no bloat
- Format
- NinjaScript add-on (.zip import)
- Delivery
- Instant — checkout page + email
NinjaTrader 8 (latest version recommended)
Any instrument — futures, stocks or FX (no volume needed)
Every chart type: tick, minute, volume, range and Renko
Any data provider — Rithmic, Kinetick, and more
Lifetime license — one-time purchase
Free updates — always current
Step-by-step installation guide
Email support from a working trader
Most traders are up and running in under a minute. Stuck on anything? Email us — we're traders too, and we answer.
Complete your setup
All 11 key intraday levels on your chart automatically — clean, labeled and fully customizable, built by a working futures trader.
Futures trading involves substantial risk of loss and is not suitable for every investor. Intraday Reference Levels is a charting and decision-support tool only — it is not a trade signal, recommendation, or financial advice. Past performance is not indicative of future results.