How to Show Multiple Timeframes on One NinjaTrader 8 Chart
NinjaTrader can put two timeframes on one chart out of the box — most people never find the setting. Here is how, why traders bother, and where the built-in approach runs out.
What multi-timeframe analysis actually means
It means checking whether the timeframe you trade agrees with the ones above it before you act. A long on a 1-minute chart is a different proposition depending on whether the 15-minute and the hourly are rising with it or leaning the other way.
The idea is not complicated and it is not new. What makes it awkward in practice is purely mechanical: the information lives on charts you are not currently looking at, and checking it means breaking off from the one you are.
Why alignment matters more than any single signal
Take the same entry in two conditions. The 1-minute says buy, and the 15-minute and hourly are both trending up: you are joining something that is already moving, and pullbacks are likely to be bought by people bigger than you. The 1-minute says buy and the hourly is trending down: the same entry is now a counter-trend scalp into supply, and it needs to be treated as one — smaller, faster, with a tighter target.
Neither is wrong. They are different trades wearing the same signal, and the only thing separating them is context from a chart you were not looking at.
That is the whole argument for multi-timeframe work, and it is why it tends to matter more than which indicator produced the entry.

How to add a second timeframe to a chart
This is built in, and it is the part most people never find:
- Right-click the chart and choose Data Series…
- Use Add to create a second series, then pick the instrument and set the interval you want — a 15-minute series alongside a 1-minute chart, for example.
- Set Panel to a new panel rather than the same one, unless you specifically want the two overlaid.
- Click OK. The second series appears in its own panel beneath the first, on the same time axis.
Once a second series is on the chart you can apply indicators to it as well. Add the indicator as usual, then set its Input Series to the series you want it to read — that is the field that decides which timeframe it calculates from. It is how you get, say, a moving average of the hourly drawn on a chart whose primary series is 1-minute.
Panels, overlays, and which to use
Two ways to place a second series, and they answer different questions.
| Placement | Good for | Cost |
|---|---|---|
| Its own panel | Seeing the higher timeframe's structure properly — its swings, its levels | Vertical space. Two or three panels and the chart you actually trade gets squeezed |
| Overlaid on the same panel | Comparing price directly, or drawing a higher-timeframe indicator over your trading chart | Clutter, and two bar sets on one scale can be hard to read at a glance |
For most people the honest answer is one extra panel at most. Past that, the chart stops being a trading chart and becomes a research screen.
Where the built-in approach runs out
Adding series works, and for two timeframes it is often enough. Three things break down as you add more:
- Space. Every timeframe costs a panel, and panels come out of the chart you are trading.
- Reading time. You are still interpreting bars. Four panels means four judgments, made quickly, under pressure, which is exactly when judgment is worst.
- No summary. There is no built-in indicator anywhere in NinjaTrader that compares timeframes and tells you which way each is trending — checked against the full indicator list and the Market Analyzer columns, and against the application's own assemblies. The platform gives you the data beautifully and leaves the comparing to you.
One name to be aware of while you look: there is a Market Analyzer column called T & S trend, which sounds like it belongs here and does not. NinjaTrader describes it as a colored bar representing incoming ticks in the Time & Sales colors — it is a tape tool, not a timeframe comparison.
What a trend readout shows instead
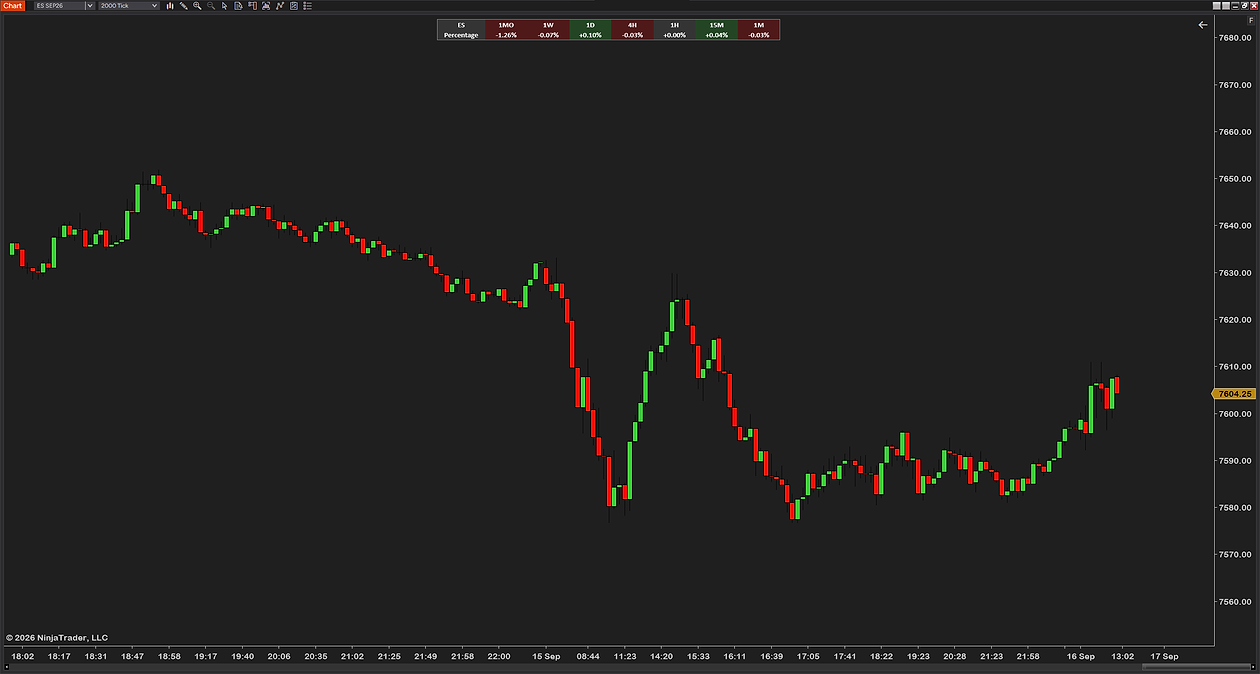
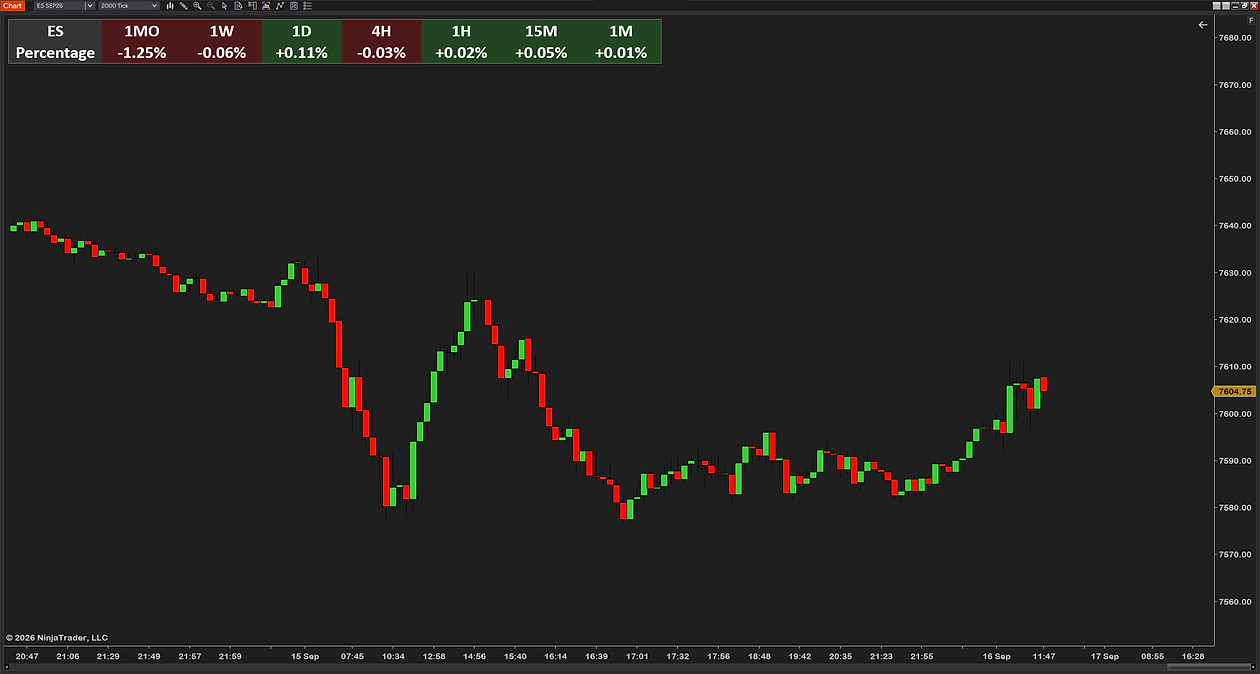
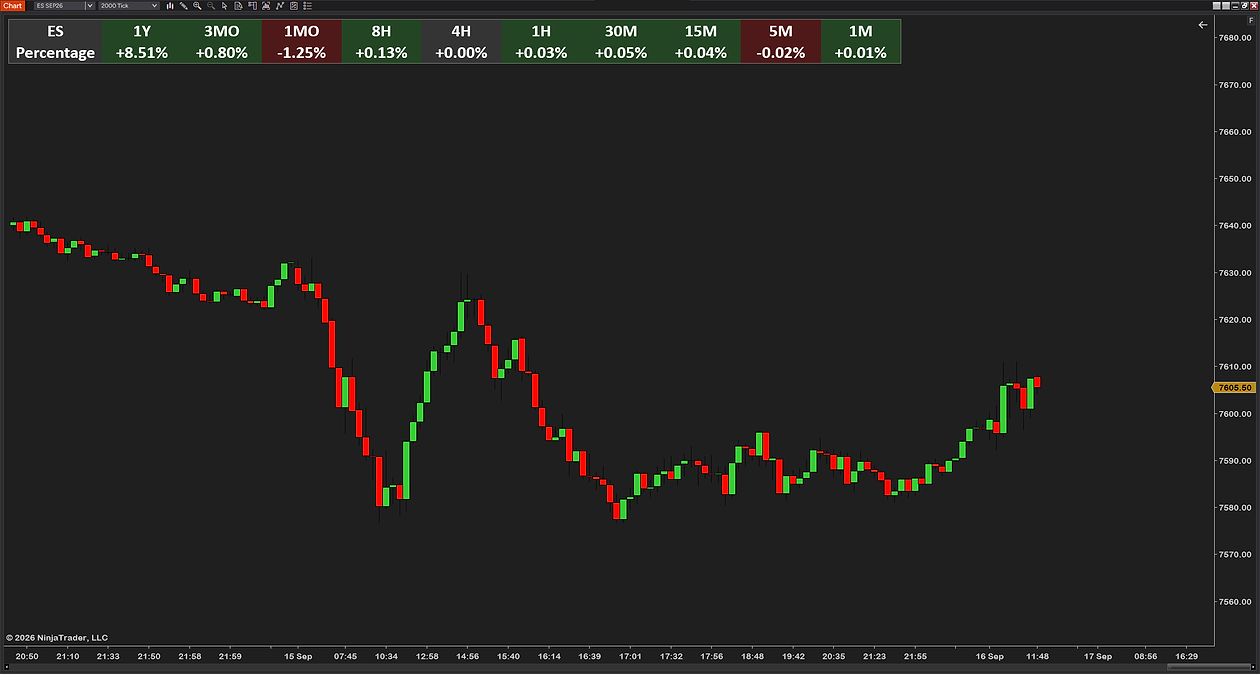
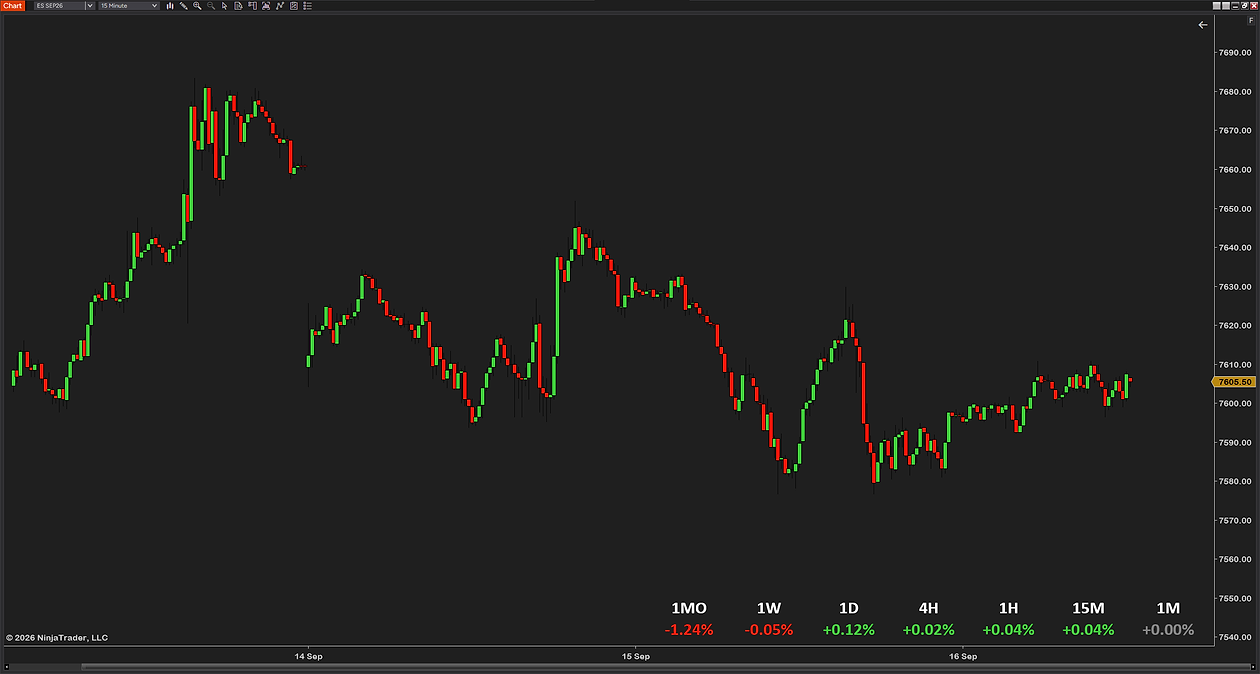
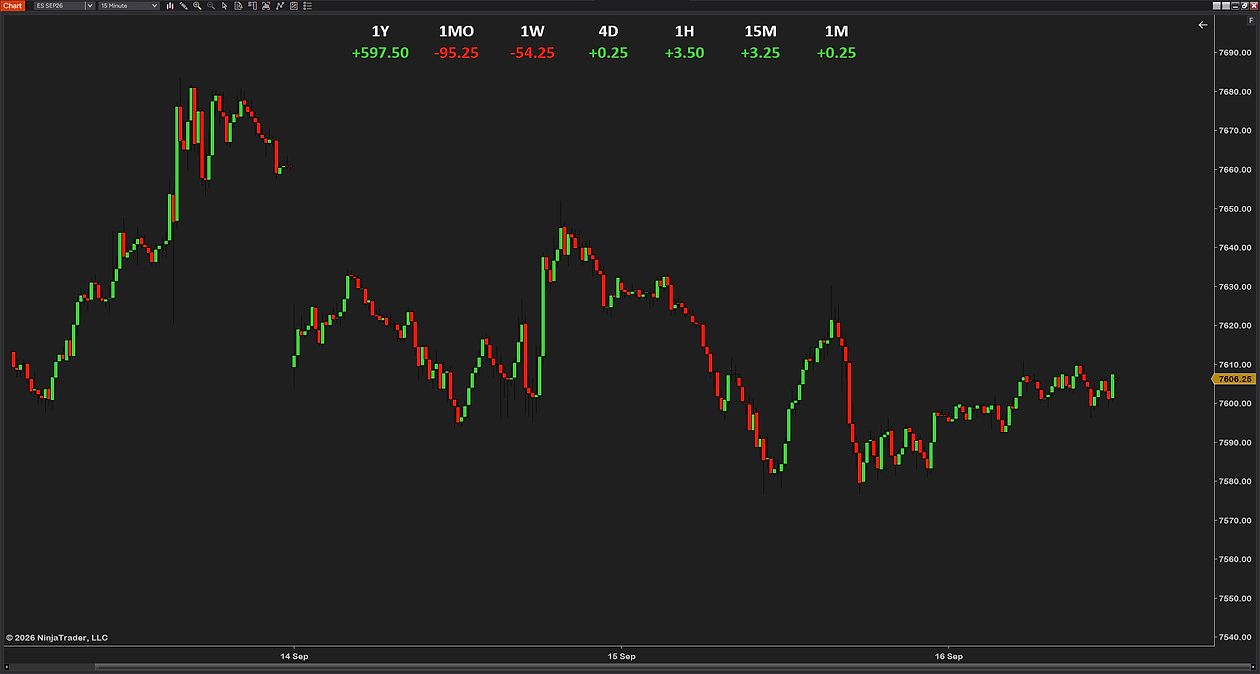
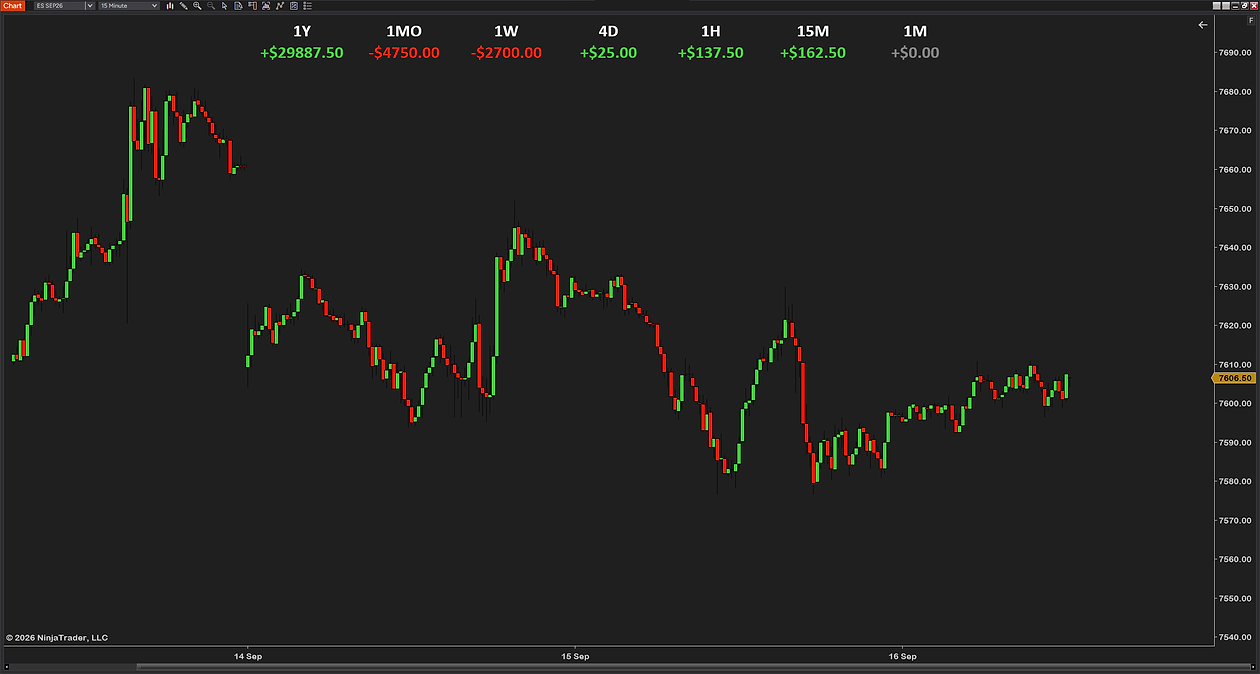
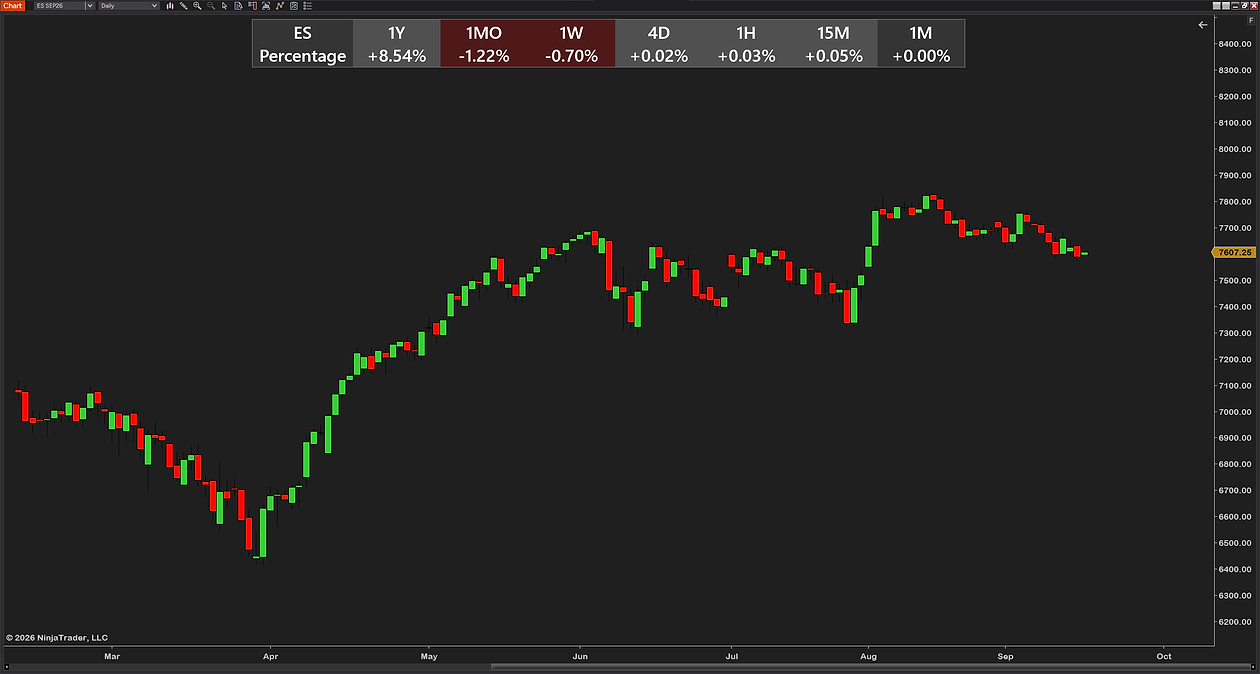
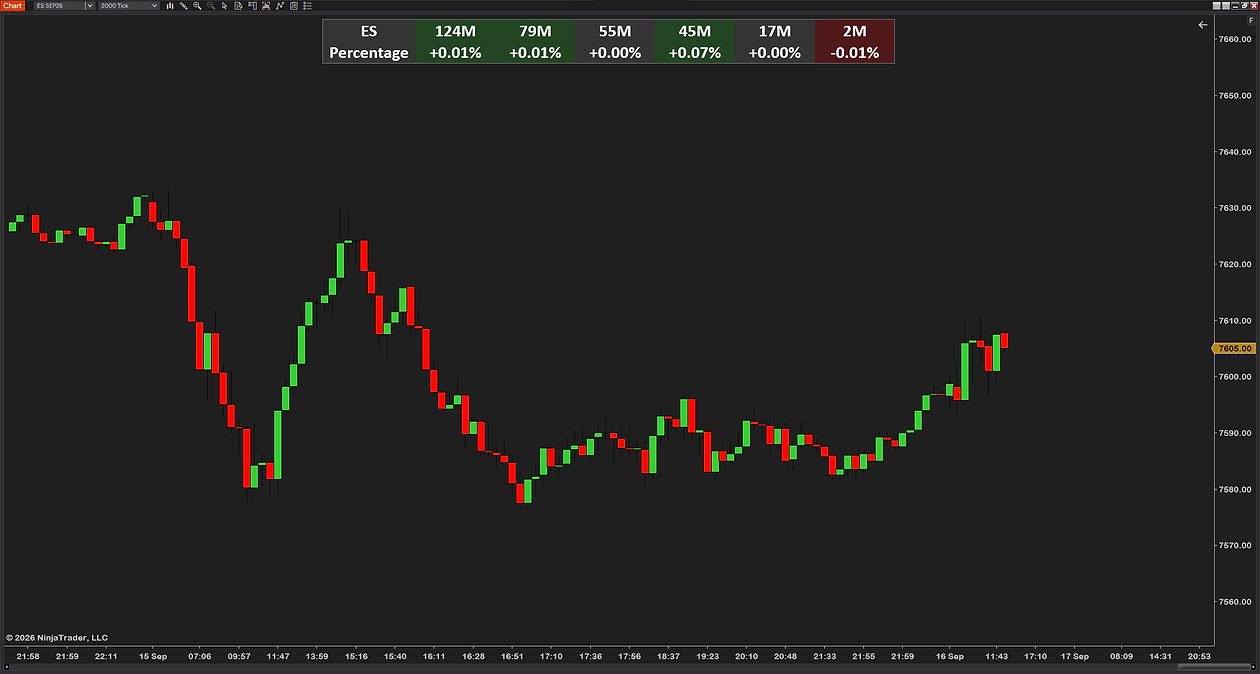
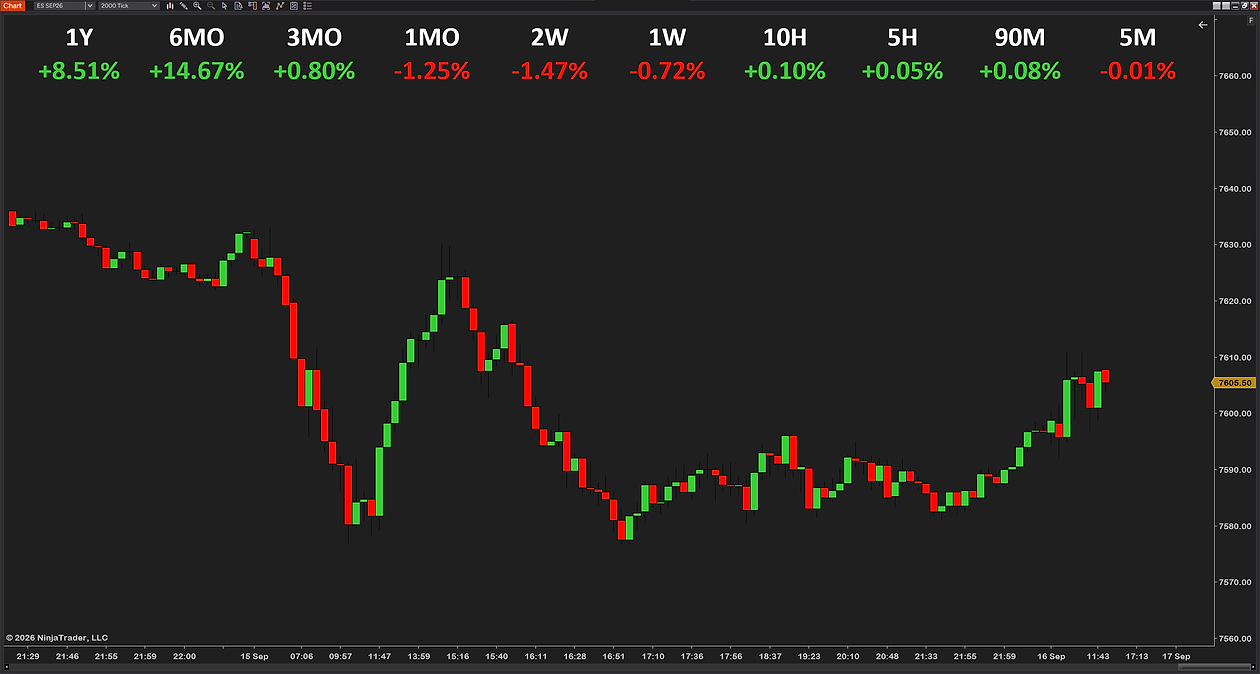
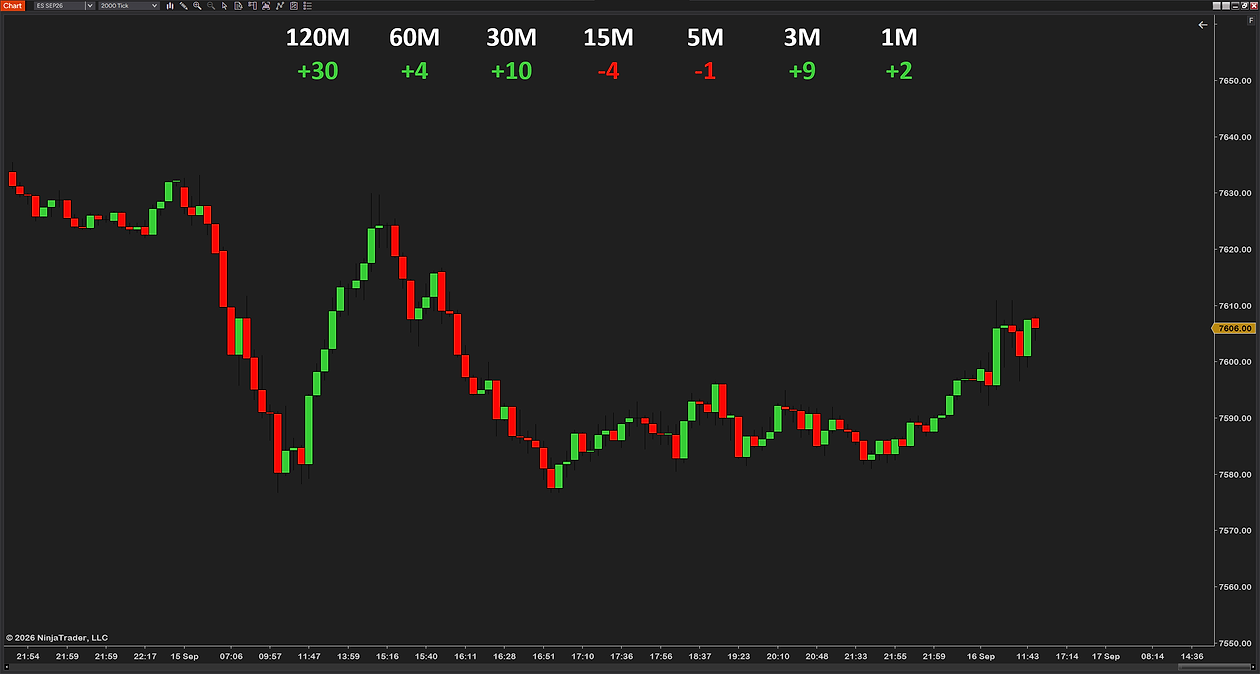
The alternative is to stop reading bars for this question and read a verdict instead: one small panel on your trading chart with a row per timeframe and a direction against each.
The value is not that it knows something you could not work out. It is that the answer is already there when you need it — in the two seconds before an entry, rather than after you have clicked through three charts and the move has gone. Our own multi-timeframe trend indicator does that for NinjaTrader 8.
What to look for in any of them: the timeframes you actually use rather than a fixed set, a stated method for how direction is decided rather than a mystery arrow, and bar-close values so the readout is not flickering while a bar is still forming.
Which timeframes to actually use
A common and sensible structure is three: the one you trade, one for context, one for the day's direction. Roughly a factor of four or five between them, so each says something genuinely different.
- Intraday futures scalper: 1-minute to trade, 5- or 15-minute for context, hourly for the day.
- Intraday swing: 5-minute to trade, 30-minute for context, daily for the day.
- Multi-day: hourly to trade, 4-hour for context, daily or weekly above.
Two timeframes an inch apart — a 1-minute and a 2-minute — tell you the same thing twice and give false confidence when they agree, which they almost always will.
Three mistakes worth avoiding
- Waiting for everything to align. Perfect alignment across four timeframes is rare and usually late. Alignment is a weighting on the trade, not a prerequisite for it.
- Adding timeframes until one agrees with you. If you are checking a fifth chart to justify a trade the first four argued against, the analysis finished a while ago and something else is happening.
- Treating a higher timeframe as permission. An hourly uptrend does not make a bad 1-minute entry good. It makes a good one better.
How to install it
- Download the multi-timeframe trend indicator — keep the .zip zipped.
- Open the Control Center → Tools → Import → NinjaScript Add-On… and select the .zip. NinjaTrader documents the process in its import guide, and we walk through every step, error message and the update rule on our installation page.
- On a chart, right-click → Indicators…, add it, and set the timeframes to the ones you actually trade.
- Watch it against your own charts for a session before you rely on it, so you know what its verdict means in practice.
Common questions
Can NinjaTrader 8 show two timeframes on one chart?
Yes, without any add-on. Right-click the chart, choose Data Series, click Add, pick the interval you want and set Panel to a new panel. The second series appears beneath the first on the same time axis, and you can apply indicators to it separately.
How do I apply an indicator to the higher timeframe?
Add the second data series first, then add the indicator and set its Input Series to that series. Input Series is the field that decides which timeframe an indicator calculates from, and it is how you draw, for example, an hourly moving average on a chart whose main series is 1-minute.
Does NinjaTrader have a multi-timeframe trend indicator built in?
No. There is nothing in the built-in indicator list or the Market Analyzer columns that compares timeframes and reports direction for each. NinjaTrader gives you the data — multiple series, multiple panels — and leaves the comparison to you.
Is "T & S trend" a multi-timeframe indicator?
No, despite the name. It is a Market Analyzer column that shows a colored bar representing incoming ticks using the Time and Sales colors. It is a tape tool and has nothing to do with comparing timeframes.
Which timeframes should I use together?
Three is a sensible structure: the one you trade, one for context, one for the day's direction, with roughly a factor of four or five between them. A 1-minute and a 2-minute are too close to tell you anything different.
Do all the timeframes need to agree before I take a trade?
No, and waiting for it usually means arriving late. Alignment is a weighting on the trade — how large, how long you hold, how much room you give it — rather than a condition that has to be met.
Does adding data series slow the chart down?
It can, because every added series loads its own history and every indicator on it does its own work. If a chart gets sluggish after you add series, that is the usual cause, and reducing the bars loaded is the first thing to try.
Related guides
- SuperTrend settings and the repaint question — one common way of deciding a single timeframe's direction.
- EMA clouds and moving-average ribbons — trend as color on the chart you are trading.
- Why a NinjaTrader chart lags — worth reading before adding a third and fourth data series.
The honest part
Checking the higher timeframe will not turn a poor strategy into a good one. What it does is stop you taking the right setup in the wrong direction, which is a specific and common way to lose money on a trade that looked fine on the chart in front of you. That is worth the panel space, and not much more than that is being claimed here.