Listed on the NinjaTrader Ecosystem NinjaTrader 8 Indicator Trend direction across up to ten timeframes of your choice, live in one panel on your chart
No machine ID No vendor license server No repaint Instant download Free updates Verified on NinjaTrader 8.1.8.2 · 16 Sep 2026
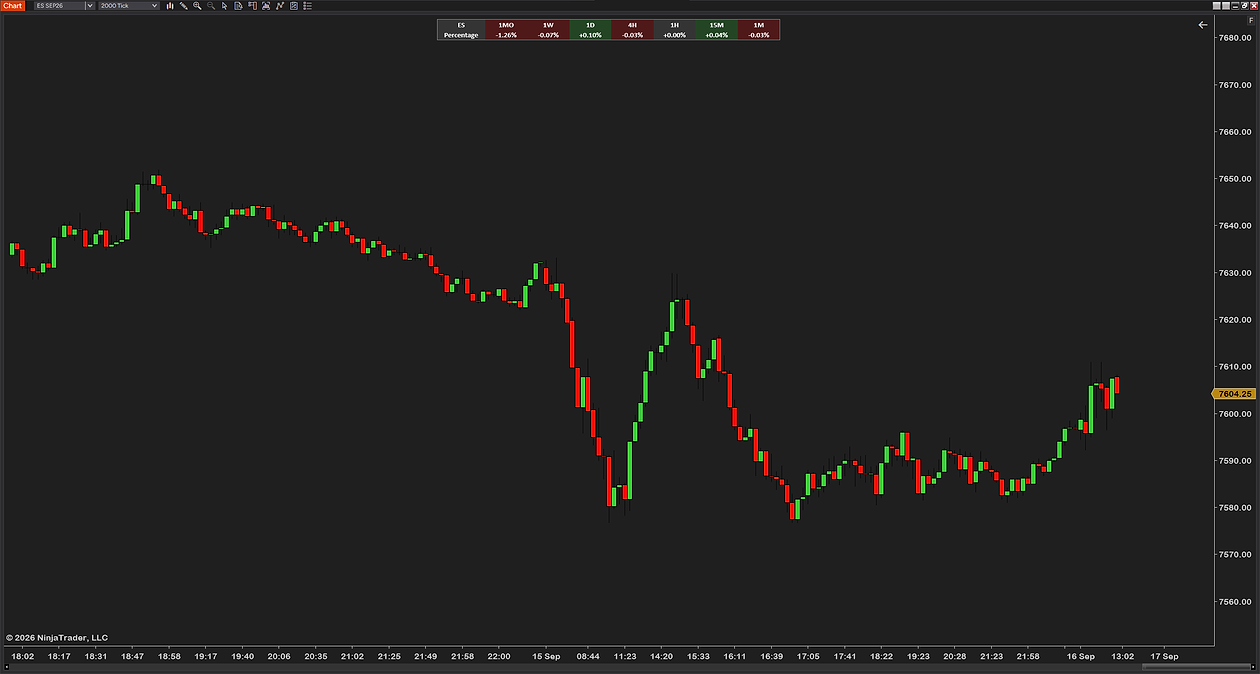
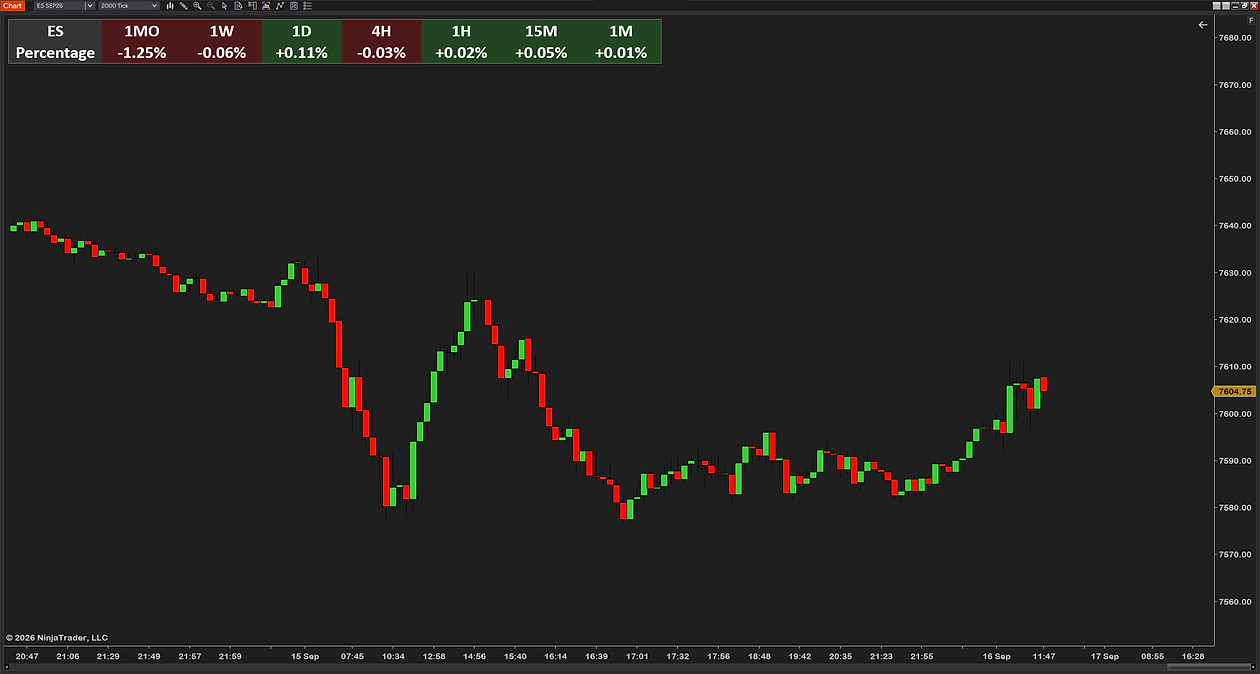
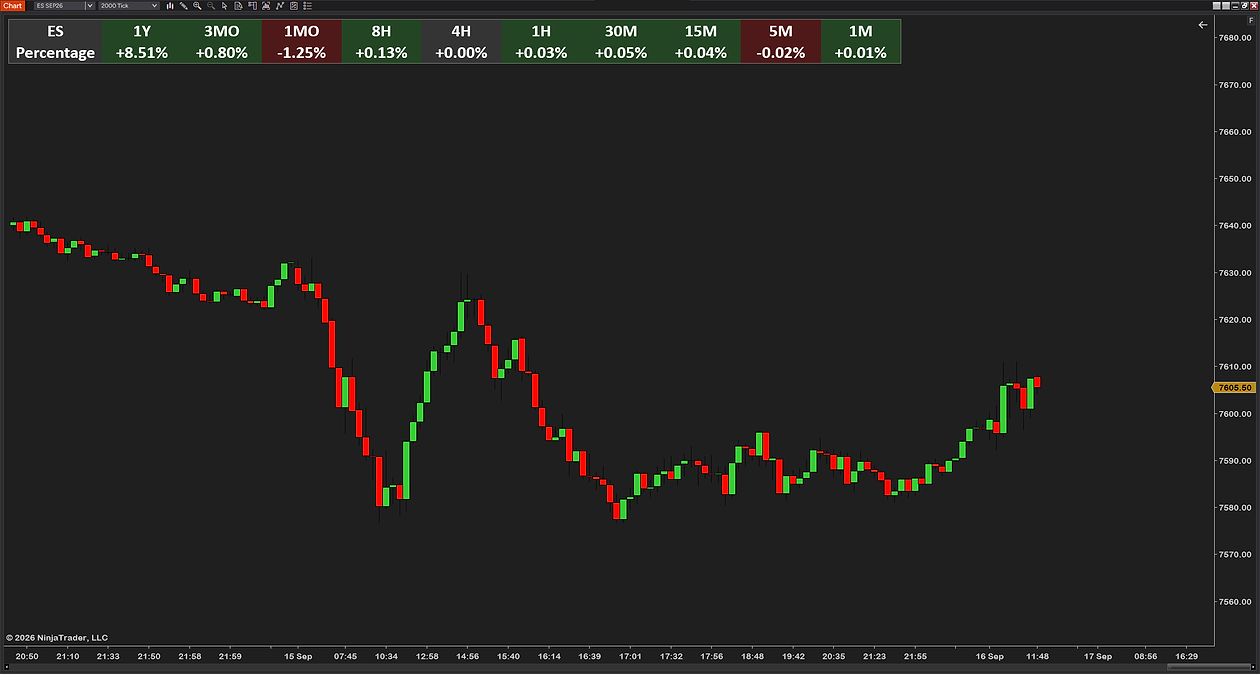
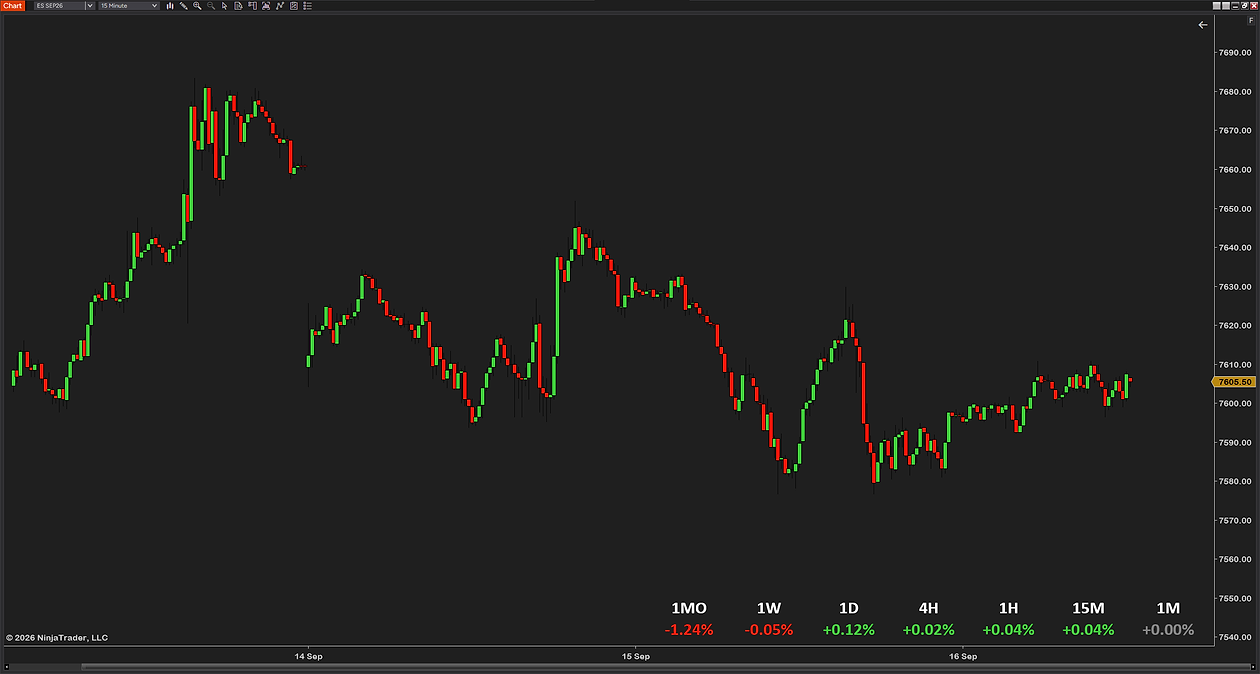
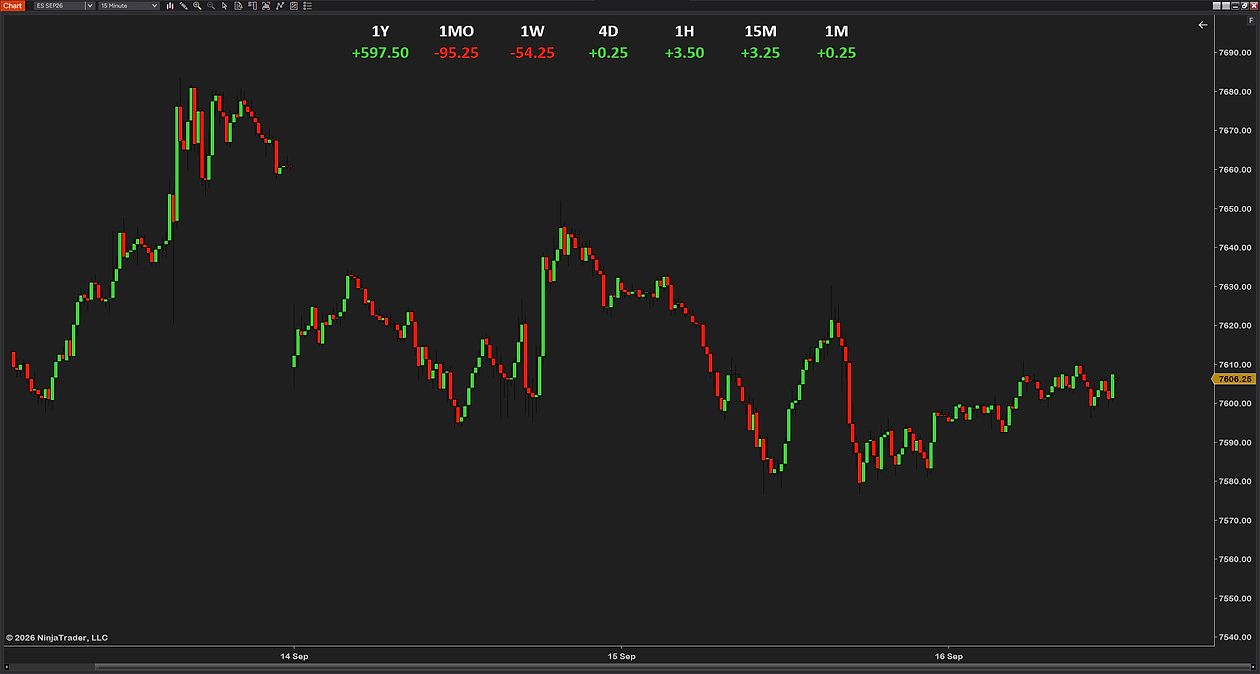
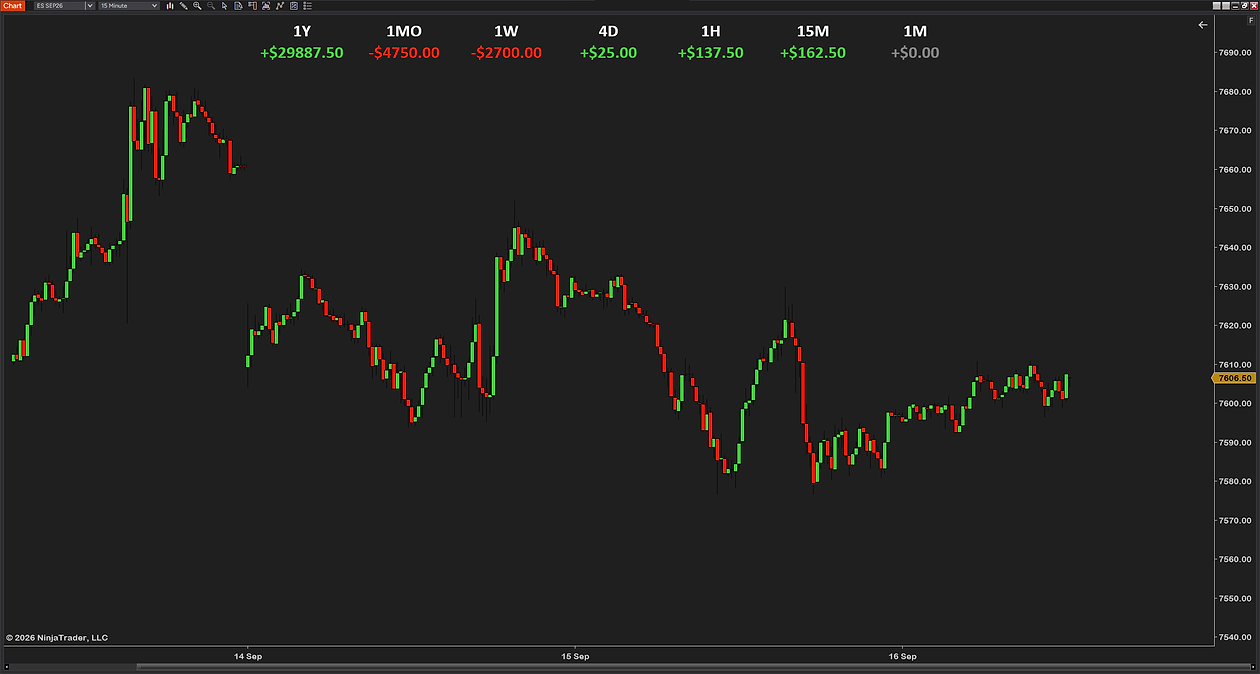
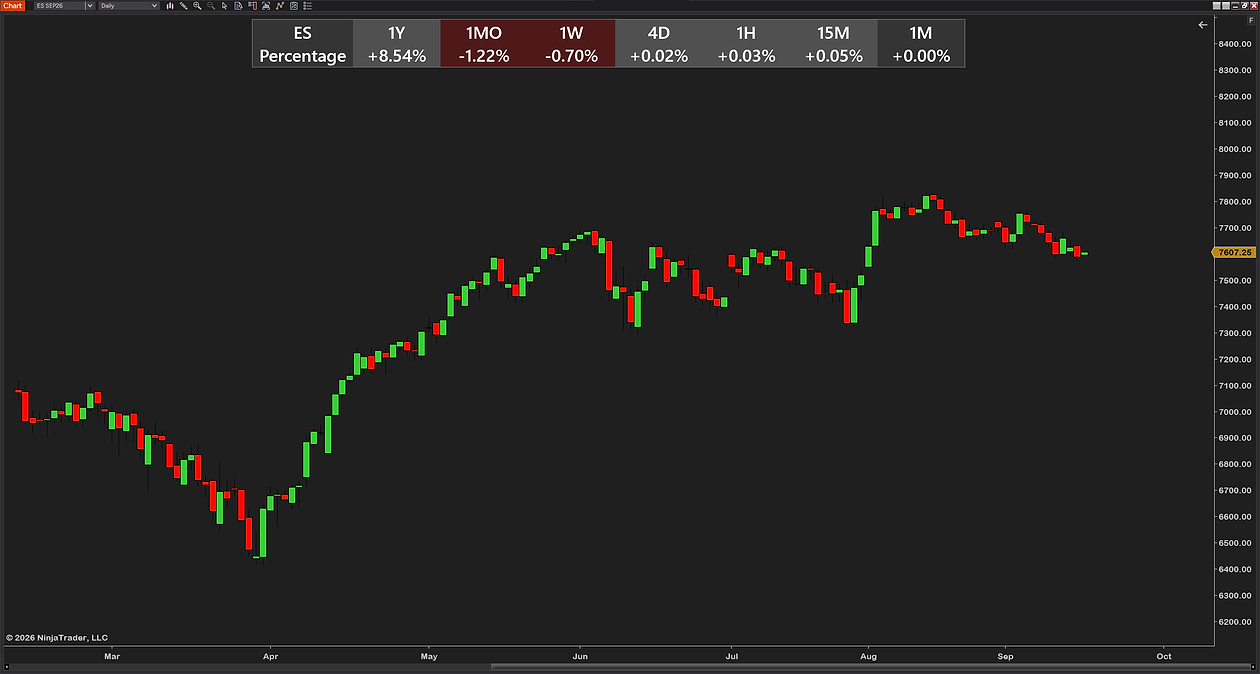
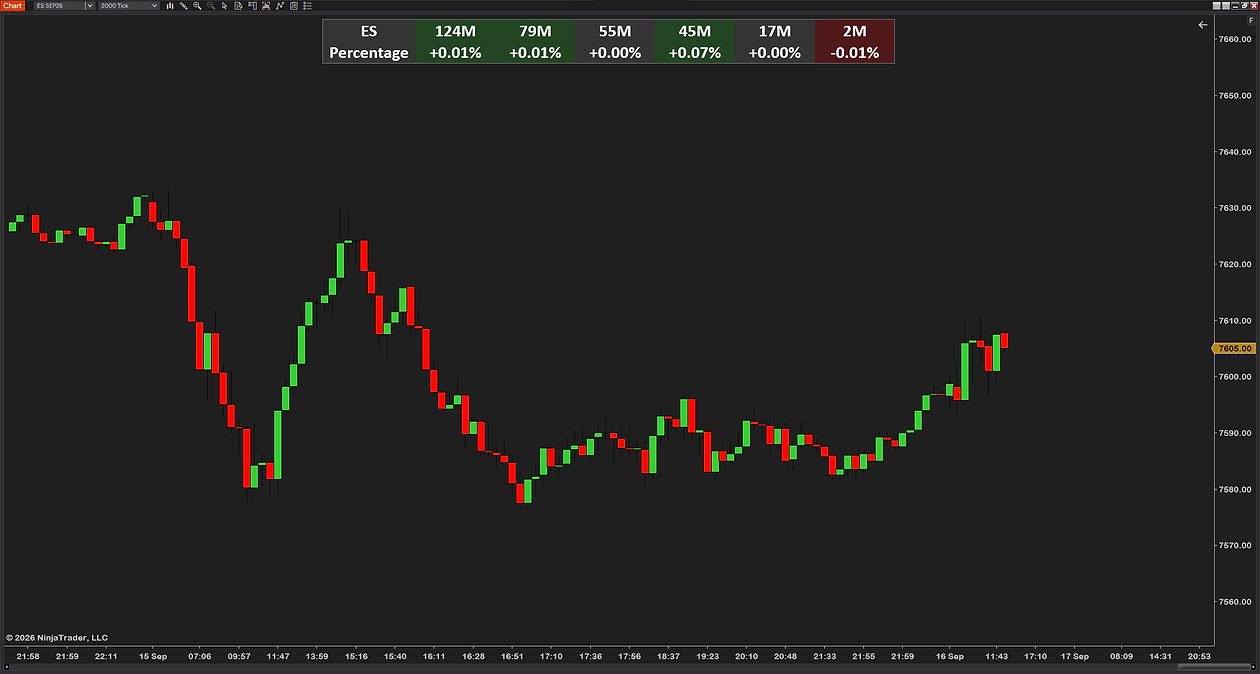
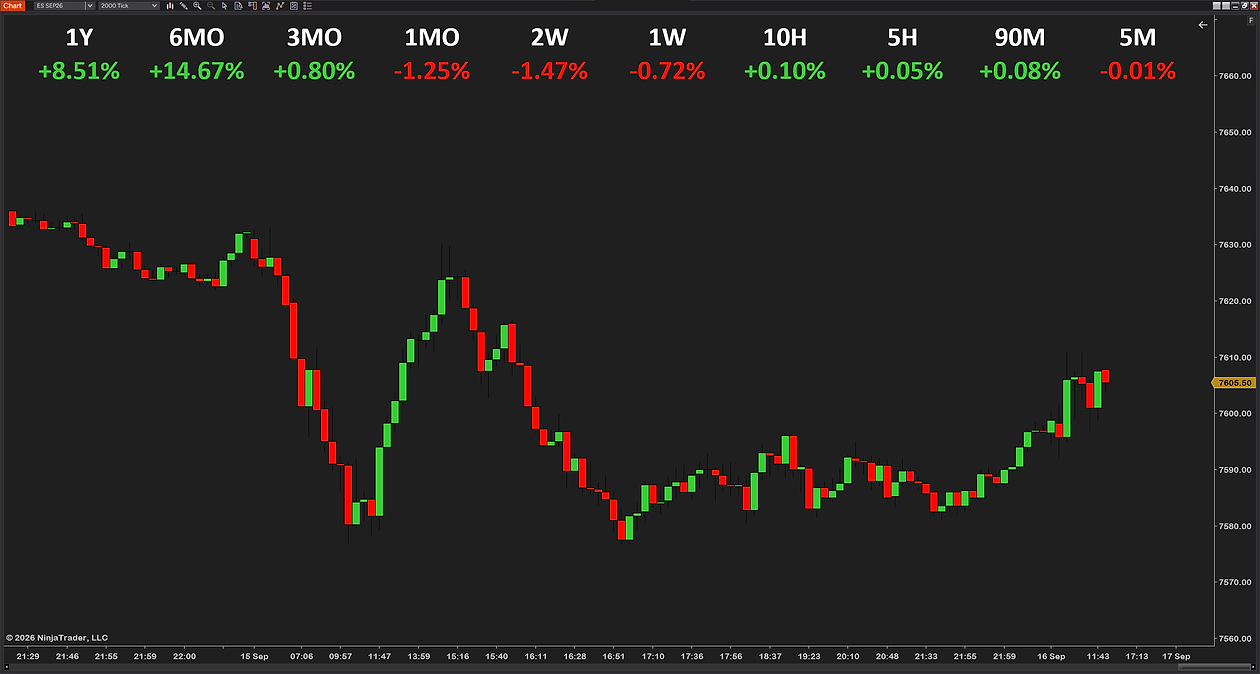
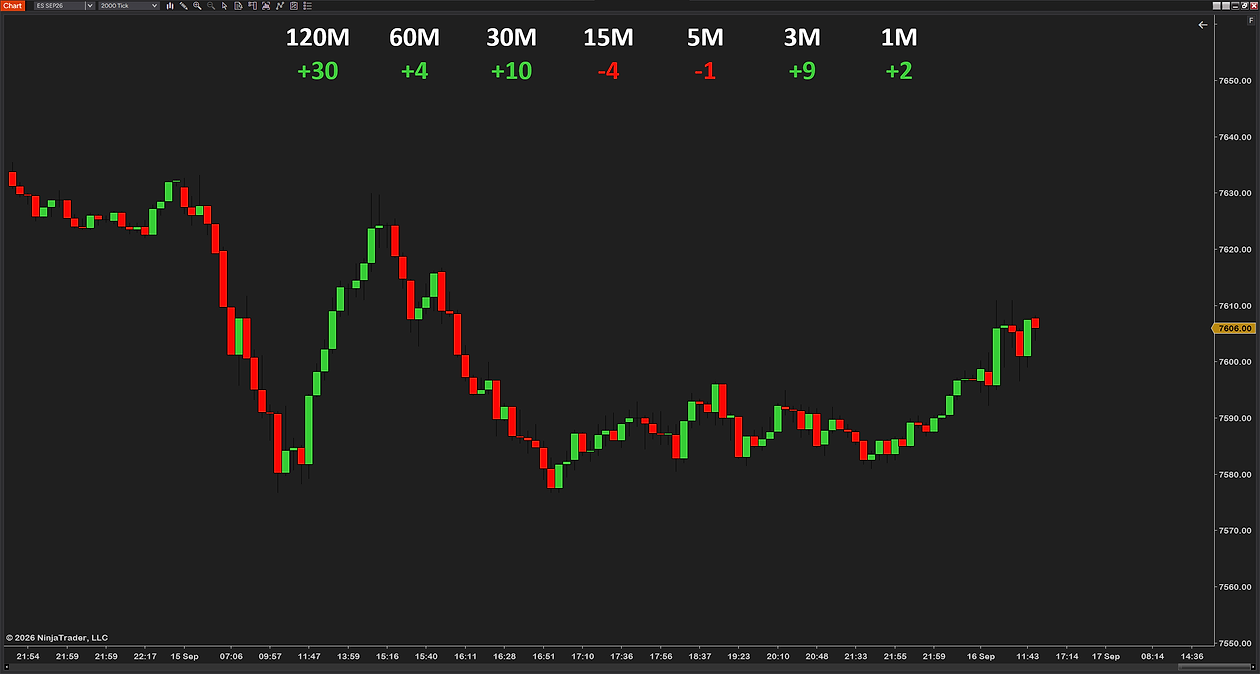
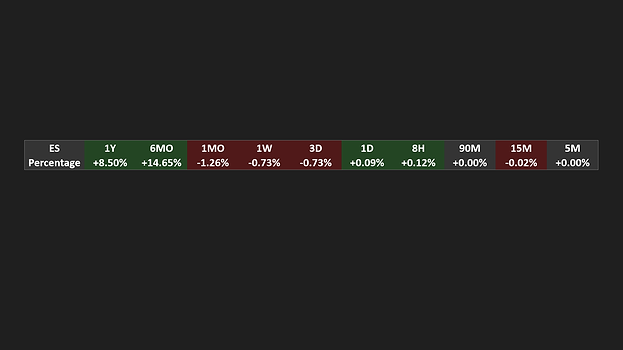
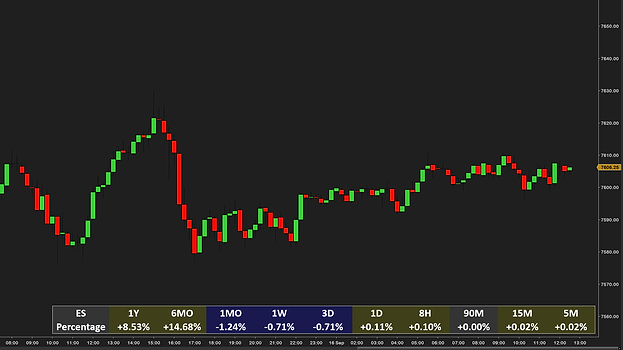
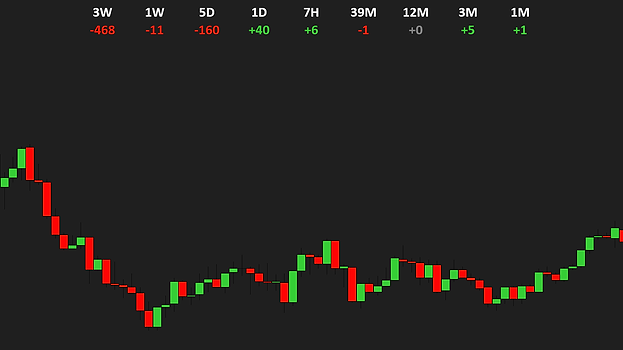
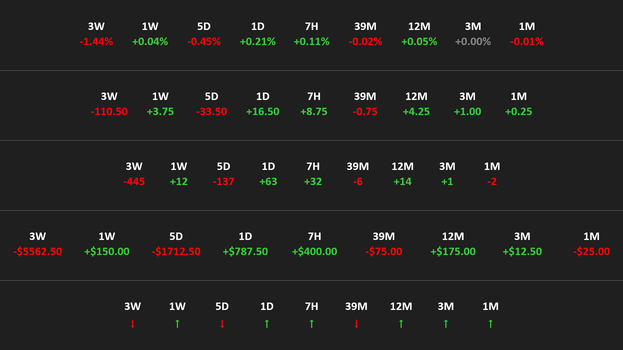
MultiTrend in table mode with the instrument header on a 2000-tick ES chart: a compact panel at the top center with the ES and Percentage header and seven cells from a month down to a minute, red cells for 1MO, 1W, 4H and 1M, green for 1D and 15M, and 1H flat at +0.00% The same seven timeframes at a large font in the top-left corner: 1MO −1.25%, 1W −0.06%, 1D +0.11%, 4H −0.03%, 1H +0.02%, 15M +0.05%, 1M +0.01% over the ES 2000-tick candles Ten timeframes in one row at a large font: 1Y +8.51%, 3MO +0.80%, 1MO −1.25%, 8H, 4H, 1H, 30M, 15M, 5M and 1M, each cell green, red or gray by its move, on a 2000-tick ES chart The panel in the bottom-right corner of a 15-minute ES chart with the table off: seven timeframes as colored text only, 1MO −1.24% down to 1M +0.00% in gray The Points stat type at the top of a 15-minute ES chart: 1Y +597.50, 1MO −95.25, 1W −54.25, 4D +0.25, 1H +3.50, 15M +3.25, 1M +0.25, green and red by direction The Dollar stat type on the same 15-minute ES chart: 1Y +$29887.50, 1MO −$4750.00, 1W −$2700.00, 4D +$25.00, 1H +$137.50, 15M +$162.50 and 1M +$0.00 in gray MultiTrend on a daily ES chart from March to October with a light cell palette: ES and Percentage header, 1Y +8.54%, 1MO −1.22%, 1W −0.70%, then 4D, 1H, 15M and 1M Custom minute slots on a 2000-tick ES chart: 124M, 79M, 55M, 45M, 17M and 2M in a table panel at the top center, showing that any minute count works Ten timeframes across the top of a 2000-tick ES chart at the largest font: 1Y +8.51%, 6MO +14.67%, 3MO +0.80%, 1MO −1.25%, 2W −1.47%, 1W −0.72%, 10H, 5H, 90M and 5M The Ticks stat type at the largest font on a 2000-tick ES chart: 120M +30, 60M +4, 30M +10, 15M −4, 5M −1, 3M +9, 1M +2
1 / 10

See every timeframe at once and which way it leans.

Choose up to 10 timeframes shown simultaneously.

What MultiTrend adds to a typical MTF panel.

The panel Typical MTF panel MultiTrend
Higher-timeframe direction on one chart no chart flipping✓✓
Up to ten timeframes, your choice any period from seconds to a year, not a fixed set✓
Live on every price change not once per bar close✓
No methodology lock-in price against a fixed anchor, nothing hidden✓
The read
Arrow, percent, points, ticks or dollars five stat types, one setting✓
Colored cells up, down and flat in your colors, opacity you set✓✓
Instrument header with the stat name so a second chart never fools you✓
Where and how
Six positions top or bottom, left, center or right✓
Ten fonts, 6 to 72 pt with a pixel offset from the corner✓
Auto-contrast readable on light charts too✓
Correct by design
Calendar anchors in session time the instrument’s own trading hours, any chart zone✓
Any chart type tick, range and Renko included✓✓
A dash instead of a wrong number when the history is not there yet✓
Works on
Chart types
Tickany count
Minuteany, daily included
Volumeany size
Range, Renkoany size
Instruments
Futuresall exchanges
Stocksand ETFs
FX and cryptono volume needed
Data providerany
Needs
NinjaTrader 88.1.5 or newer, free included
DataLevel 1 is enough
Extra feedsnone, it loads its own
Machine IDnone

In short: NinjaTrader 8 and any instrument with a price. That is all MultiTrend needs.

A calendar cell needs the history to reach back that far: a year cell on a chart loaded with two days of data shows a dash, not a guess. Sub-minute slots need a tick, second, volume or range chart.

Get MultiTrend on your chart

All plans give you instant access to MultiTrend, ready to use right away. No machine ID required.

14-day free trial

$0/14 days

Ends by itself. Nothing to cancel, nothing charged.

Start free trial
Included:
  • Every setting of the paid version
  • Ten timeframe slots, seconds to a year
  • Five stat types, six positions, ten fonts
  • No card required
  • No vendor license server
  • Same install as the full version

Licensed through NinjaTrader’s vendor licensing.

Buy now

$69/once

One-time payment, lifetime license.

Buy now
Everything in the trial, plus:
  • Yours to keep — no renewal, no expiry
  • One license — every computer you own
  • Free updates
  • Support by email — answered within a day
  • 14-day money-back guarantee
  • Instant download after checkout

Secure checkout via Creem. Price includes tax.

Monthly subscription

$6.99/mo

Billed monthly. Cancel any time from your account.

Subscribe
Everything in Buy now, while subscribed:
  • One license — every computer you own
  • Free updates while subscribed
  • Support by email — answered within a day
  • Cancel any time from your account
  • Instant download after checkout

Secure checkout via Creem. Price includes tax.

How traders use it

Four ways to read one panel. None of them is a signal; the entries, the stops and the discipline are still yours.

Before the entryThe alignment check

One glance: are the higher timeframes with you? If they are not, you had better have a reason.

ChopThe chop detector

Cells flashing both colors means nobody is in control. Many traders read that as a reason to size down or sit out, and the panel makes it hard to miss.

SwingThe swing filter

Run day, week and month slots and see which side the longer timeframes lean before you take a position.

DeskThe one-glance desk

Replace the chart-flipping ritual: ten timeframes in one corner of one chart, updating on every price change.

New to multi-timeframe trading? Read the full guide →

Why choose us.

61+Countries(all products)
4.8/5★Average rating(all products)

Free trial on every paid product. Full refund within 14 days. Custom changes on request. Very few NinjaTrader 8 vendors offer all three. We do it for one reason: you should never have to pay to find out whether a tool works on your chart. Most of our tools are free. The paid ones are extensively tested, kept up to date and priced well below the usual rate. We would rather earn a customer who comes back than make a sale that does not last. Questions? Email [email protected]. We answer fast.

260+Traders(all products)
700+Downloads(all products)
World map with every country running UsefulIndicators highlighted

What our customers are saying

Frequent questions.

Question or idea for improvement? Email us, we reply fast.

Download the zip after checkout, then in NinjaTrader 8 go to Tools → Import → NinjaScript Add-On and pick the file. Add MultiTrend to any chart from the Indicators list, switch on the timeframes you want, and the panel fills within a few seconds — most traders are done in under a minute. The step-by-step guide covers every message NinjaTrader can show and the update rule.

Any of ten slots, each with its own period type and value: seconds, minutes, hours, days, weeks, months or a year. 73 minutes, 8 hours, 3 days, 12 weeks — whatever fits your trading. Seven slots come switched on, a month down to a minute; the rest are yours to fill.

No. Every cell compares the last traded price with a fixed anchor: the open of the period, or the price a set time ago. The cell changes as price moves — that is the point — but nothing historical is drawn or redrawn, and no cell ever claims something about the past that it did not show at the time.

No, and we won’t pretend it is. It tells you which way each timeframe leans right now, so you know whether the tide is with you. Alignment is context, not a guarantee. The decisions stay yours.

No. MultiTrend never touches your orders, positions or account. It draws a panel on the chart — every order is yours to place, in your own order-entry window, exactly as before.

On apply, MultiTrend loads two small reference series of its own — one-hour bars for the calendar periods, one-minute bars for the trailing windows — so a day, week or month cell reads the same on a tick chart as on a daily chart. A year slot loads a full year of hourly bars and takes a little longer. It happens once per apply, not while you trade.

A dash means MultiTrend would rather show nothing than a wrong number: the chart does not hold enough history for that period yet, the market is closed between sessions, or a sub-minute slot sits on a chart that has no sub-minute data. Load more days in the Data Series dialog, or wait for the session to open.

It’s built lean — it works only when the price changes, the panel text is laid out once and cached, and it pauses when the chart tab is hidden. If your chart ever lags with it on, email us: that’s a bug, not normal.

Email support, answered by the traders who built it. Bugs get fixed, and updates are free.

The Nerd Vault

The one formula, the anchors and the logic behind every cell MultiTrend draws.
How it’s calculated
Percentage = ( last − anchor ) ÷ anchor × 100

Every cell is the last traded price against one anchor price for that timeframe. Percent divides by the anchor; points, ticks and dollars are the same difference in the instrument’s own units; the arrow is only its sign. Green when positive, red when negative, gray when it rounds to zero.

Anchorcalendar = open at the boundary

A day, week, month or year cell anchors to the open of the session that contains the calendar boundary — the first trade of the week for 1W, the first trade of the month for 1MO — found in the instrument’s own trading hours, so a chart in Oslo and a chart in Chicago read the same number.

Anchortrailing = price N units ago

A second, minute or hour cell anchors to the price a set time ago, read from a one-minute reference series so it works on any chart type. Hour windows stop at the open of the instrument’s own session (for CME futures that is 18:00 ET the evening before): a 4H cell at 19:00 ET reads from the 18:00 open, never from the previous session.

Hover a term to see it in the drawing and the table
UpDownFlatAnchorproduct default colors
ONE PRICE, SEVEN ANCHORS · MES, LAST 7581.50 TIME AXIS COMPRESSED · A MONTH ON THE LEFT, THE LAST MINUTE ON THE RIGHT 7630760075707540 7581.50 7562.507625.757554.257590.507587.507573.257581.50 1MO1W1D4H1H15M1M +0.25%−0.58%+0.36%−0.12%−0.08%+0.11%+0.00% Seven anchors on one price path, and the seven cells they produce, in the product’s default colors (cells drawn in the Table style). An illustration drawn from the worked example below, not market data.
Worked example · the seven default slots on MES, last price 7581.50Tick 0.25 · $1.25 per tick · $5 per point
SlotAnchor ruleAnchorPointsTicksDollarsPercentCell
1MOopen of the session holding the 1st7562.50+19.00+76+$95.00+0.25%green
1Wopen of the session holding Sunday7625.75−44.25−177−$221.25−0.58%red
1Dopen of the current session7554.25+27.25+109+$136.25+0.36%green
4Hprice 4 hours ago, clipped at the session open7590.50−9.00−36−$45.00−0.12%red
1Hprice 1 hour ago7587.50−6.00−24−$30.00−0.08%red
15Mprice 15 minutes ago7573.25+8.25+33+$41.25+0.11%green
1Mprice 1 minute ago7581.50+0.00+0+$0.00+0.00%gray

Points × 4 = ticks on MES; points × $5 = dollars, per contract. The instrument’s tick size and point value come from NinjaTrader, so the same panel reads correctly on NQ, CL, 6E or a stock. The dollar cell is for one contract or share.

Calendar anchors

Day, week, month and year cells anchor to the open of the session that contains the boundary, found with NinjaTrader’s own session iterator in the instrument’s trading hours. For CME index futures the week opens Sunday 18:00 ET, and that is the 1W anchor whatever zone your chart is drawn in.

Trailing windows

Second, minute and hour cells compare the last price with the price N units ago, read from a one-minute reference series of the instrument, so a 15M cell reads the same on a tick chart, a range chart and a daily chart. Hour windows are clipped at the current session’s open.

What “now” is

“Now” is the timestamp of the current minute of the instrument’s own one-minute feed, never the forming bar of your chart. A daily chart’s current bar carries a time hours in the future; anchoring on it would put every trailing cell off by most of a day.

Honest dashes

When the chart does not hold enough history for a period, when the market is between sessions, or when a sub-minute slot sits on a chart with no sub-minute data, the cell shows a dash instead of a number. A wrong number in the right color is the one thing this panel must never do.

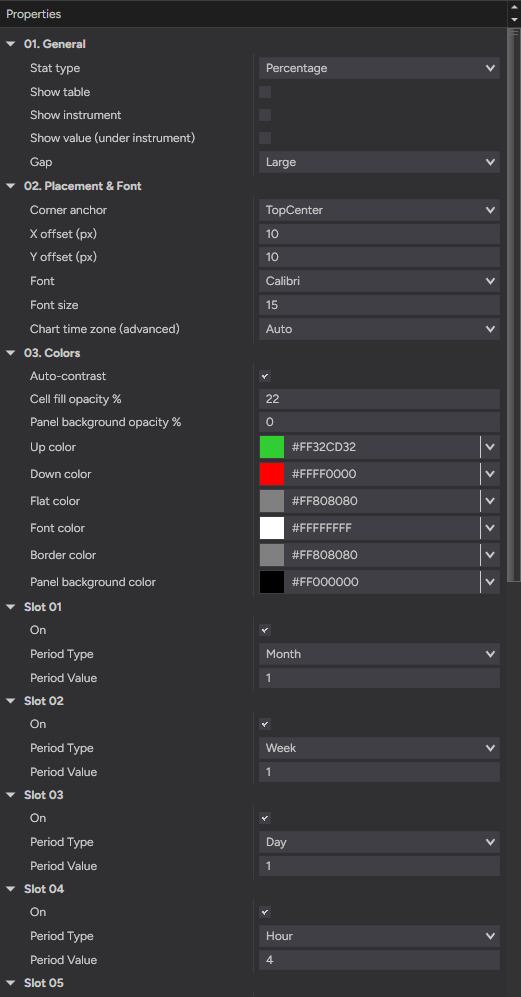
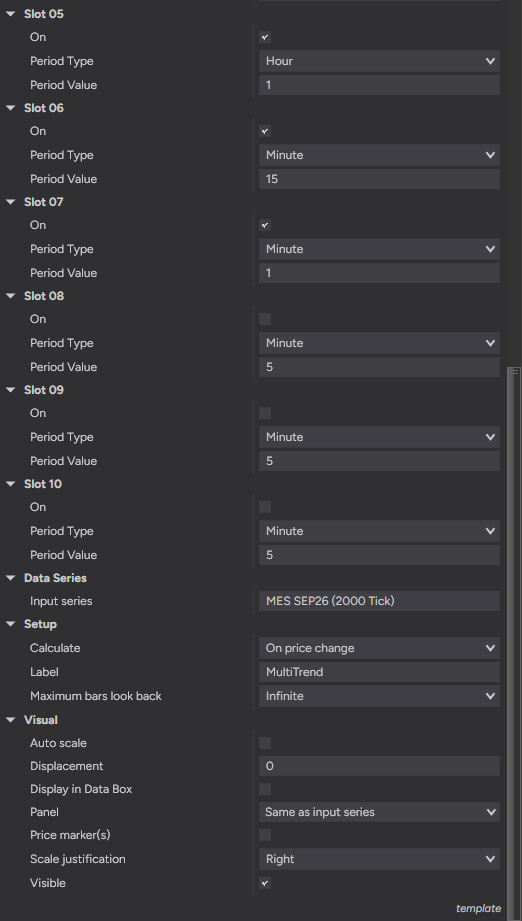
This is the actual settings panel in NinjaTrader — numbered groups, plain-English names, no cryptic abbreviations. Every row in the table below is one of these; each of the ten slots is its own group.

MultiTrend settings — general, placement and font, colors, the first slots
MultiTrend settings — the ten timeframe slots
SettingDefaultRange
General
Stat typePercentageArrow · Percentage · Points · Ticks · Dollar
Show tableOffOn · Off
Show instrumentOffOn · Off
Show value (under instrument)OffOn · Off
GapLargeSmall · Medium · Large · Extra Large
Placement & Font
Corner anchorTop CenterTop Left · Top Center · Top Right · Bottom Left · Bottom Center · Bottom Right
X offset (px)100 – 4000
Y offset (px)100 – 4000
FontCalibriSegoe UI Semibold · Segoe UI · Segoe UI Black · Consolas · Consolas Bold · Cascadia Code · Arial Bold · Verdana · Tahoma · Calibri
Font size156 – 72
Chart time zone (advanced)AutoAuto · US Eastern · US Central · US Mountain · US Pacific · UTC · London · Central Europe · Tokyo · Sydney
Colors
Auto-contrastOnOn · Off
Cell fill opacity %220 – 100
Panel background opacity %00 – 100
Up colorLime GreenAny color
Down colorRedAny color
Flat colorGrayAny color
Font colorWhiteAny color
Border colorGrayAny color
Panel background colorBlackAny color
Slot 01
OnOnOn · Off
Period TypeMonthSecond · Minute · Hour · Day · Week · Month · Year
Period Value11 – 999
Slot 02
OnOnOn · Off
Period TypeWeekSecond · Minute · Hour · Day · Week · Month · Year
Period Value11 – 999
Slot 03
OnOnOn · Off
Period TypeDaySecond · Minute · Hour · Day · Week · Month · Year
Period Value11 – 999
Slot 04
OnOnOn · Off
Period TypeHourSecond · Minute · Hour · Day · Week · Month · Year
Period Value41 – 999
Slot 05
OnOnOn · Off
Period TypeHourSecond · Minute · Hour · Day · Week · Month · Year
Period Value11 – 999
Slot 06
OnOnOn · Off
Period TypeMinuteSecond · Minute · Hour · Day · Week · Month · Year
Period Value151 – 999
Slot 07
OnOnOn · Off
Period TypeMinuteSecond · Minute · Hour · Day · Week · Month · Year
Period Value11 – 999
Slot 08
OnOffOn · Off
Period TypeMinuteSecond · Minute · Hour · Day · Week · Month · Year
Period Value51 – 999
Slot 09
OnOffOn · Off
Period TypeMinuteSecond · Minute · Hour · Day · Week · Month · Year
Period Value51 – 999
Slot 10
OnOffOn · Off
Period TypeMinuteSecond · Minute · Hour · Day · Week · Month · Year
Period Value51 – 999

Ranges are printed only where the indicator enforces one. Period values are capped per type: seconds 60, minutes 720, hours 24, days 30, weeks 12, months 12, year 1. Colors accept any color.

MultiTrend calculates only when the price changes — never once per tick when the last price is unchanged, never on a timer. Each cell is a snapshot, so text and color always belong to the same moment. Labels and cell sizes are laid out once and cached; a cell’s value is re-laid out only when its text actually changes, and the whole indicator pauses while the chart tab is hidden. The two reference series are sized to what the enabled slots need: a default set loads about ten weeks of hourly bars, a year slot a full year, and nothing more. If your chart ever lags with MultiTrend on, that is a bug and we want to hear about it.

Calendar anchors are found in the instrument’s trading-hours template (US Eastern for CME futures), so the day, week and month cells do not move when you change your chart’s display zone. The one place the chart zone matters is telling which calendar day “today” is; MultiTrend reads it from your PC clock, which is NinjaTrader’s default. If you run NinjaTrader with a display zone different from your PC clock, set the same zone in Chart time zone (advanced) and the cells agree with your chart again.

The file
MultiTrend_v1.0.zip, 183 KB. A standard NinjaScript import: Tools → Import in NinjaTrader 8, nothing else to install. Delivered instantly on the checkout page and in your email receipt.
The license
One-time purchase, yours to keep. Tied to your NinjaTrader account email, not to a machine: install it on every computer you own.
Updates
Every update is free and installs the same way, over the top of the old one.
Support
Email, answered by the traders who built it. Bugs get fixed. A step-by-step installation guide and the support page are there if you ever need them.
Platform
NinjaTrader 8.1.5 or newer, the free tier included. One license, every computer you own. One-time purchase, free updates.
Chart types
Every bar type; see the Heikin-Ashi note below. Slots shorter than a minute need a chart with sub-minute data (tick, second, volume or range); on a minute chart or coarser they show a dash.
Heikin-Ashi
On a Heikin-Ashi chart the percent, points, ticks and dollar magnitudes are measured against the smoothed HA close, not the traded price; the direction is unaffected. Use a standard chart for exact numbers.
History
A calendar cell needs the loaded history to reach its anchor. A week cell needs the week’s open on the chart’s own hourly reference; a year cell loads a year of hourly bars and takes a few seconds longer to apply.
Precision
Trailing windows are read to the minute, so a 1M cell measures from the start of the current minute and short windows can be up to a minute short. The most recent week’s 1W cell can differ by a few dollars between a tick chart and a daily chart of the same instrument: NinjaTrader assembles their hourly reference from different data, and the difference fades as the week ages.
Weekends
Between sessions the day and trailing cells show a dash: there is no current session to anchor to.
Year
A year slot is capped at 1 and a month slot at 12: one year back is the deepest the panel reaches.

MultiTrend itself makes no network connection. Its two reference series come from your own data feed through NinjaTrader, the same way every chart does. The only license check is NinjaTrader’s own, the same one every Ecosystem product uses. Nothing about you, your account, your charts or your trades is sent anywhere, and there is no telemetry.

Verification
Runs on
NinjaTrader 8.1.8.2.
Last checked
16 Sep 2026, on our own live charts. The date changes only when the indicator has actually been run on that version.
Current build
v1.0, released 23 Jun 2026. Every update is free.
Changelog
v1.0 · 23 Aug 2026
Licensing moved to NinjaTrader’s own vendor licensing (Ecosystem product 2172, 14-day trial); no functional change.
v1.0 · 23 Jun 2026
Initial release: ten customer-defined timeframe slots from seconds to a year, five stat types (arrow, percent, points, ticks, dollars), six panel positions, ten fonts, auto-contrast, calendar periods anchored in the instrument’s own trading hours, live on every price change.

See every timeframe on your own chart before you decide.

Fourteen days, every setting, no card. It switches itself off, and if it stays, it is $69 once and yours to keep.

Not for you if you want a system that tells you when to enter. MultiTrend tells you which way each timeframe leans right now, in your numbers and your colors; the trade is yours.

Pairs well with Free SuperTrend indicator (ATR trailing stop line) · Free EMA cloud indicator (EMA Color Zones) · ProVWAP VWAP indicator