Heiken Ashi Candles

Free
Free download NinjaTrader 8 Chart Style

Classic or smoothed Heikin Ashi on any bar type, with the real prices underneath

No machine ID No license server Real prices kept Instant download Free updates Verified on NinjaTrader 8 · 6 Nov 2026
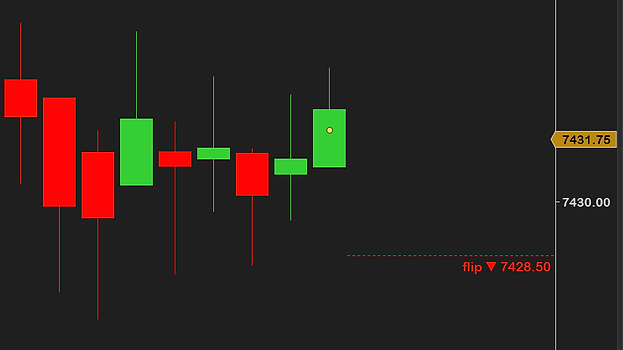
NinjaTrader 8 chart of ES DEC26 one-minute bars on 5 November 2026, about 20:35 to 22:04 Central European time, drawn with Heiken Ashi Candles in white and red, showing a white rally, a red drop, a sideways stretch of mixed candles, a second red drop, and the newest candle with the flip line at 7371.75 and the last price 7377.25 on the price axis
A chart style, not a bar type

The toolbar still reads 1 Minute, because the bars stay one-minute bars. Heiken Ashi Candles only changes how they are drawn.

A trend in one color

Never rounded to the tick. Each candle opens at the middle of the one before, so a move reads as one color.

A range in mixed colors

Both colors, no long run. When the market goes sideways, the candles show it too.

The turn

The first red candle after the white run. On a finished candle, a change of color marks the turn.

The newest candle

The red line is the flip price. A close there turns the candle red. The gold tag on the axis is the last real trade.

A real NinjaTrader 8 chart of ES one-minute bars with Heiken Ashi Candles, 5 Nov 2026, at the default settings with a wider bar and our chart colors. The times on the chart are Central European.

Heiken Ashi shows the trend your candles hide

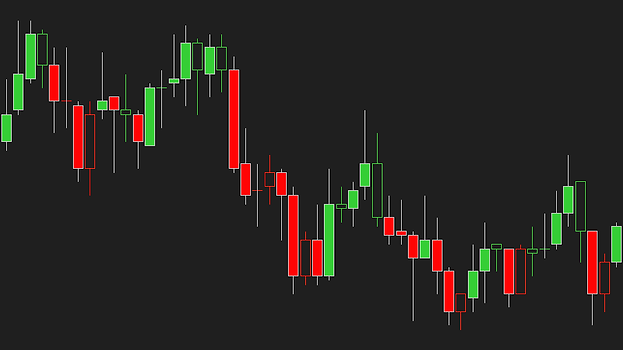
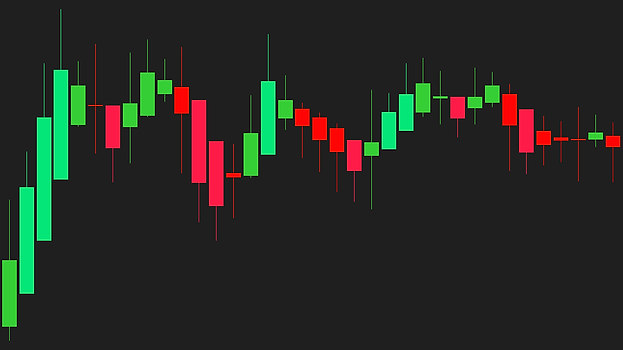
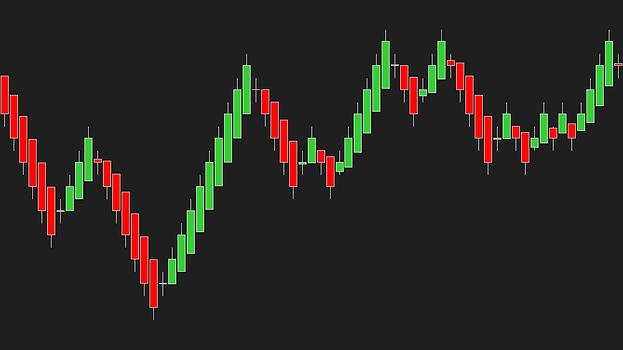
Two NinjaTrader 8 charts of the same ES one-minute bars on 6 Nov 2026, from 18:20 to 20:01. Above, normal candlesticks switch between red and green all through a fall and a climb. Below, Heiken Ashi Candles with Smoothed switched on show the fall as one long run of red candles and the climb after 19:25 as one long run of green.

The same ES minutes twice, normal candles on top and Heiken Ashi Candles below with Smoothed switched on. The same trend, with less noise.

Customize every part of your Heiken Ashi candles

NinjaTrader 8 Data Series window with Type Minute, Value 1 and Chart style Heiken Ashi Candles and its rows, with bar width 9, Candles shown Heiken Ashi candles, Smoothed off with SMMA 6 and WMA 2 under it, Restart at each session off, up candles white, down candles red, Wick matches body on, Highlight strong candles off, Real price dots on the newest candle, Flip line on
Two looks

Heiken Ashi candles, or your real candles in Heiken Ashi colors, hollow where the real candle went the other way.

Classic or smoothed

Off is classic Heiken Ashi. On adds an average before and after, SMMA 6 and WMA 2 by default.

Strong candles, real price

Strong candles can get their own colors, and the dot marks the real close of the newest candle.

The flip line

The price where a close turns the newest candle the other color, drawn out to the price axis.

In Data Series, pick the Type first, then Heiken Ashi Candles as the Chart style. The bars underneath keep their real prices.

Heiken Ashi on top, real prices underneath.

The candles Built-in Heiken Ashi Candles
Heiken Ashi candles on the chart each open from the middle of the candle before✓✓
Strategies and the Strategy Analyzer a strategy reads the candles in a backtest and live✓✓
Real prices, exact candles
Backtest fills on the real bars a strategy on NinjaTrader’s Heiken Ashi bar type fills at averaged prices✓
Other indicators read the real bars a VWAP or an ATR sees the market, not the averages✓
Exact values, never rounded to the tick each candle carries the formula’s own numbers✓
Any bar type
Tick, volume, second, minute and day bars the bar types NinjaTrader’s own Heiken Ashi builds on✓✓
Range, Renko, Line Break and other bar types our free Dollar Bars included✓
Reads the candle for you
The flip price where a close would turn the candle the other color✓
Strong candles in their own color no wick against the direction✓
Real price dots the real close, on the newest candle or on all of them✓
Real candles in Heiken Ashi colors hollow where the real candle went the other way✓
Yours to set
Smoothed Heiken Ashi five averages before and after the candles✓
Restart at each session each session starts from its own open✓
Alerts on a color change and a strong candle on the finished candle, once✓
Free, with free updates no trial, no locked settings, no license key✓✓
Works on
Bar types
Timesecond, minute and day
Tick and Volumeany size
Range and RenkoLine Break too
Custom bar typesDollar Bars included
Works in
Chartslive and on reload
Strategy Analyzerbacktests, optimization
Market Replaythe same after a reload
Tick Replaychart and Analyzer
Needs
NinjaTrader 8recent version, free included
Datathe bars on your chart
Licensenone, nothing to activate
Machine IDnone

All Heiken Ashi Candles needs is NinjaTrader 8 and a chart.

The candles are worked out from the bars NinjaTrader hands the chart, so they follow your bar type, your trading hours and your data provider. We checked them on 8.1 million candles worked out from 1.4 million real bars of 29 futures markets.

Get Heiken Ashi Candles on your chart

You might ask why this is free, and what the catch is. There is none. We want to change the market for third-party NinjaTrader tools, and giving our work away is part of how we do it.

To say it plainly, this market is overpriced and full of low-quality tools with missing features and bugs. Vendors charge hundreds of dollars for simple indicators. No indicator, add-on or tool will make you profitable. A good one makes your trading environment better, and you know that already, or you would not be here looking.

Our goal is the highest-quality products we can build, tools that make a real difference on the chart. We get there by testing hard, on live charts before every release, with feedback from the traders who use them and a close read of what the forums complain about. We offer a full refund within 14 days, we adapt tools for customers who ask, and we give most of our work away.

Most of our tools are free for a reason. We want you to try them, see the quality and the features for yourself, and not spend a dollar with us until you think a tool deserves it. We are a business and we intend to make money, by solving real problems for traders.

So yes, Heiken Ashi Candles is completely free, no strings attached. If you like it, there are more free tools and paid ones priced well under what is usual in this market. If you have any questions, please email us at support@usefulindicators.com.

Free download

$0/forever

No card, no license key, no expiry. Nothing to cancel because nothing was started.

Download free
Included:
  • The chart style, the Heiken Ashi Values indicator, every setting
  • Free updates
  • Support by email — answered within a day
  • One zip, one import, one NinjaTrader restart
  • No license server, no machine ID

Your download is on your order page right after checkout.

How traders use it

Four ways to use Heiken Ashi candles. None of them is a signal. The candles show the trend in a calmer way, and the trade is yours.

TrendsOne color while the move lasts

Each candle opens at the middle of the one before, so a trend reads as a run of one color and a turn as a change of color. Smoothed candles change color less often.

ExitsA level to watch

The flip line shows the close that would turn the newest candle the other color. You can watch it to trail a stop or to wait for a turn.

Bar typesCalmer Renko, range and tick charts

The candles go on any bar type, and the bars underneath stay real for your orders, Chart Trader and your other indicators.

StrategiesBacktests on real prices

Heiken Ashi Values hands Direction, Strong, Streak and the flip price to a strategy. The strategy runs on the real bars, so its fills follow the real prices.

Heiken Ashi prices are averages, so they trail the market, and more with smoothing. They show the trend, they do not predict it, and we make no claim of an edge.

Frequent questions.

Can’t find the answer to your question? Email us, we answer fast.

Download the zip, then in NinjaTrader 8 (NT8) go to Tools → Import → NinjaScript Add-On, pick the file, and restart NinjaTrader once so the new chart style is in the list. Right-click a chart and open Data Series. Pick your bar type first, then pick Heiken Ashi Candles as the Chart style. Changing the Type later sets the chart style back to the type’s own, so pick it again then. For alerts and the Data Box, add Heiken Ashi Values from the Indicators window, where it is HeikenAshiValues, one word. A strategy calls it in code. The step-by-step guide covers every message NinjaTrader can show and how to update.

Genuinely free — no trial period, no locked settings, no license key, nothing to upgrade to. The download button opens a $0 checkout that asks for your name and email, no card; your download is on your order page right after that step. News emails come only if you check the optional Insider list box at checkout. We sell other tools; free tools like this one are how we show you the quality of the work first.

Heiken Ashi, also written Heikin Ashi, is Japanese for average bar. The Heiken Ashi formula works each candle out from its bar’s prices and the candle before it. The close is the average of the bar’s open, high, low and close. The open is the middle of the previous candle’s body. The high and low are the bar’s own, stretched to hold that open and close. So, unless Restart at each session is on, a candle never opens with a gap, a trend shows as a run of one color, and small moves against it leave short wicks. The open and close of a Heiken Ashi candle are averages, not prices that traded.

A normal candlestick shows what traded in its bar, its real open, high, low and close. A Heikin Ashi candle averages them with the candle before, so the color changes less often, a trend shows as a run of one color and the small moves inside it fade. The price of that calm is lag. Its open and close are averages that trail the market and are not prices you could trade. Heiken Ashi Candles keeps both on one chart. The candles are drawn in Heiken Ashi while the real prices stay underneath for your orders, other indicators and the real price dots, and Real candles in Heiken Ashi colors shows your own candles colored by the trend instead.

Yes, as a bar type, which NinjaTrader spells Heiken Ashi. NinjaTrader 8’s Heiken Ashi bar type replaces the bars themselves with Heiken Ashi bars, rounded to the tick, so a strategy on it trades those averaged prices. It builds on tick, volume, second, minute and day bars and up. Heiken Ashi Candles is a chart style instead. It draws the candles on the bars you already use, Renko and range included, and leaves their real prices for your orders, the price axis, other indicators and backtests. It adds smoothing, the flip price, strong candles, real price dots and alerts.

No. A finished candle never changes, and a reload gives the same candles as live. We recorded candles live, reloaded and compared them bar by bar on a live chart, in Market Replay and on ten bar types side by side, every one the same. The one exception is the data itself. Where your provider’s history differs from what the live feed sent, a reload follows the history. The candle forming now follows the price until its bar closes, like any candle, and smoothing only averages bars that have already happened.

The price at which a close would turn the newest candle the other color. The flip line draws it from that candle to the price axis, in the color the candle would turn, with the price written at its end. A close at that price turns the candle and a close one tick short does not. We checked that on 8.1 million candles worked out from real bars of 29 futures markets. The line moves as the candle’s high and low grow, and when the price is off the chart it is written at the chart’s edge. A candle that closes exactly level with its open keeps the color of the candle before it, so the flip price can be that level. A close there is drawn as a doji line, and its direction and alerts already count as the other color.

Most traders look at three things. A run of one color is a trend, and candles with no wick against their direction show it strong, which Highlight strong candles gives colors of their own. Small bodies with wicks on both sides show the move slowing. A change of color on a finished candle marks a possible reversal, and the flip price shows where a close would turn the newest candle the other color. None of it is a signal on its own, and the trade stays yours.

Smoothed Heiken Ashi averages the prices before the candles are made, and the candles again after. With Smoothed on, the defaults are the original Smoothed Heiken Ashi, an SMMA of 6 bars before and a WMA of 2 after. Each average can be SMA, EMA, WMA, SMMA or HMA, over 1 to 100 bars. Smoothed candles change color less often and trail the price more. Their high and low always hold the open and close, also with HMA.

Heiken Ashi Candles has two parts. The chart style’s settings sit under Chart style in Data Series, and the Heiken Ashi Values indicator has nine settings in three groups. Both are covered here under six headings, and the names in bold are the names you will see there.

The chart style and the candles shown

Right-click the chart and open Data Series. Pick the Type first, then pick Heiken Ashi Candles as the Chart style; changing the Type later sets the chart style back to the type’s own. Bar width works as on NinjaTrader’s candles. Candles shown picks Heiken Ashi candles, the default, or Real candles in Heiken Ashi colors, your own candles colored by the Heiken Ashi direction and hollow where the real candle went the other way. Either way the chart keeps its real prices for orders, indicators and backtests.

Classic or smoothed, and the session restart

Smoothed is off by default, the classic Heiken Ashi. On, Smoothing - average before (SMMA) over Smoothing - bars before (6) averages the open, high, low and close before the candles are made, and Smoothing - average after (WMA) over Smoothing - bars after (2) averages the candles after, the original Smoothed Heiken Ashi. Each average is SMA, EMA, WMA, SMMA or HMA over 1 to 100 bars, and 1 means no average. Restart at each session, off by default, starts each session’s candles and averages fresh from its own open, on intraday charts with Break at EOD on.

Colors, wicks and the candle outline

Color for up candles and Color for down candles color the bodies. Wick matches body, on by default as on NinjaTrader’s Candlestick, draws the outline and the wicks in the candle’s own color, with Wick style and Wick width, 1 to 10. Off, they take the colors of Candle outline and Candle wick, except a hollow real candle, which keeps its own color. In Heiken Ashi candles with Wick matches body on, Doji color is the line of a candle that closed level with its open. An indicator that paints bars still paints the candles.

Strong candles, real price dots and the flip line

Highlight strong candles, off by default, gives candles with no wick against their direction Strong up color (bright green) and Strong down color (bright red); a wick under half a tick counts as none. Real price dots puts a dot in Dot color (amber) at the candle’s real close, on the Newest candle by default, on All candles while the dots fit between them, or Off. Flip line, on by default, draws the price where a close would turn the newest candle the other color, from that candle to the price axis, with the price at its end. The strong colors and the dots belong to Heiken Ashi candles, not to the real candles.

Heiken Ashi Values, the same calculation for strategies

Heiken Ashi Values is HeikenAshiValues in the Indicators window. 01. Heiken Ashi and 02. Smoothing hold the same six settings as the chart style, with the same names and defaults; set them alike when you use both, and a note on the chart says so while they differ. It hands out HAOpen, HAHigh, HALow, HAClose, Direction, Strong, Streak and FlipPrice to strategies and the Data Box, and draws no candles or lines. In a strategy the average types are numbers, 1 SMA, 2 EMA, 3 WMA, 4 SMMA and 5 HMA.

Alerts on a color change and a strong candle

The alerts are in 03. Alerts of Heiken Ashi Values. Alert on color change and Alert on strong candle are off by default; a candle that does both gives one alert. Play a sound, on by default, plays NinjaTrader’s Alert2 for up and Alert4 for down. Alerts come once per candle, only on finished candles and only while the chart is live, so a forming candle that changes color and back never alerts.

An up candle with no lower wick, or a down candle with no upper wick, the sign of a strong move. Heiken Ashi opens fall between ticks, so a wick under half a tick counts as none, the way it looks on the chart. Highlight strong candles gives them colors of their own, Heiken Ashi Values can alert on them, and a strategy reads them as Strong, 1 up, -1 down and 0 for the rest.

Yes. It reads the bars NinjaTrader hands the chart, so it works on any bar type. We measured it on tick, volume, range, second, minute, day, Renko and Line Break bars, and on our free Dollar Bars. On NinjaTrader’s own Heiken Ashi bar type the bars are already Heiken Ashi, so they are drawn as they are and a note on the chart says so. In Data Series, pick the bar type first and the chart style after it. Every NinjaTrader bar type is explained in our bar types reference.

Yes, with Heiken Ashi Values. Run the strategy on your real bars and read Direction, Strong, Streak, the flip price or the four Heiken Ashi prices from the indicator. The fills then follow NinjaTrader’s fill rules on the real bars, not on averaged prices. We ran it in the Strategy Analyzer, in an optimization, with Tick Replay and live on a Sim account. A strategy run on a Heiken Ashi bar type fills at the averaged prices instead, so its backtest can show fills at prices that never traded.

Yes, Heiken Ashi Values comes in the same download. The chart style draws the candles. Heiken Ashi Values hands the same numbers to strategies, the Data Box and alerts, and draws no candles or lines. Both use one calculation, so with the same settings and the same bars a strategy sees exactly the candles you see. A strategy whose data starts on another day can differ for a few dozen bars, or several hundred with 100-bar SMMA or EMA smoothing. Each has its own settings, and Heiken Ashi Values shows a note on the chart while the two differ.

Yes. Call NTL_HeikenAshiValues(smoothed, restartEachSession, smoothBeforeType, smoothBeforePeriod, smoothAfterType, smoothAfterPeriod), for example NTL_HeikenAshiValues(false, false, 4, 6, 3, 2) for classic candles. The average types are numbers, 1 SMA, 2 EMA, 3 WMA, 4 SMMA and 5 HMA, and one is passed even when Smoothed is off. It hands out HAOpen, HAHigh, HALow, HAClose, Direction (1 up, -1 down), Strong (1, -1 or 0), Streak (the candles of one color in a row, plus for up and minus for down) and FlipPrice. On a finished candle FlipPrice is that candle’s own level, not where the next candle turns. The values follow the strategy’s own bars and trading hours. We have not tested it in the Strategy Builder, in Market Analyzer columns or on a strategy’s added data series.

Usually for one of three reasons. Heiken Ashi carries each candle into the next, so a chart that starts on another day starts from another first candle. With classic candles that difference halves with every candle and is gone from view within about ten. With heavy smoothing, such as a 100-bar SMMA or EMA, it can last several hundred bars, and with Restart at each session on two charts agree from the first session both have. Another tool may start the first candle from the middle of its body instead of its open, which differs the same way at the start of a chart. And the bars underneath differ when the data, the trading hours or the session break differ.

Off, the default, the candles run on unbroken across sessions. On, each session’s first candle starts from its own opening price, and the smoothing and the streak start again, so the gap between sessions stays visible. It follows your chart’s trading hours and works on intraday charts with Break at EOD on. On a daily chart, or a chart with one bar per session, leave it off.

Yes, from Heiken Ashi Values, both off by default. Alert on color change fires when a finished candle has a different color from the one before, and Alert on strong candle when a strong candle finishes. A candle that does both gives one alert. They fire once per candle and only on finished candles, so a forming candle that changes color and back never alerts. Each adds a line to NinjaTrader’s Alerts Log and, with Play a sound on, plays Alert2 for up and Alert4 for down. Alerts work while the chart is live, and NinjaTrader finishes a candle when the next one starts.

No. A redraw took about 2 milliseconds on our live ES chart, and only the newest candle is worked out again as the price moves. With 100-bar averages on a very long chart, about a year of one-minute bars, the candles can take a few seconds to build when the chart loads or a setting changes. If your chart ever lags with it, email us, that’s a bug, not normal.

Email support, answered by the traders who built it. Bugs get fixed — this tool gets the same updates and support as our paid tools.

See Heiken Ashi candles on your own chart.

Free, no card, no license key. Download it, import it, and pick Heiken Ashi Candles as the Chart style in Data Series.

Not for you if you want buy and sell signals. Heiken Ashi Candles shows the trend in calmer candles, and what you trade on them is yours.

Pairs well with Free Dollar Bars bar type · Free ATR trailing stop indicator (UT Bot Alerts) · Free VWAP indicator

We also offer custom builds

Can’t find the tool you need? We’ll build it.

Tell us what you want to see on the chart. You get a fixed price and a written plan before any work starts.

Request a free quote

Every tool on this site started as an idea like yours.

A key levels indicator we built, on a NinjaTrader chart A moving-average zones indicator we built, on a NinjaTrader chart A VWAP indicator we built, on a NinjaTrader chart