UT Bot Alerts

Free
Free download NinjaTrader 8 Indicator

ATR trailing stop indicator: Buy and Sell signals that never repaint after a bar closes, plus alerts

No machine ID No license server No repaint Instant download Free updates Verified on NinjaTrader 8 · 8 Oct 2026
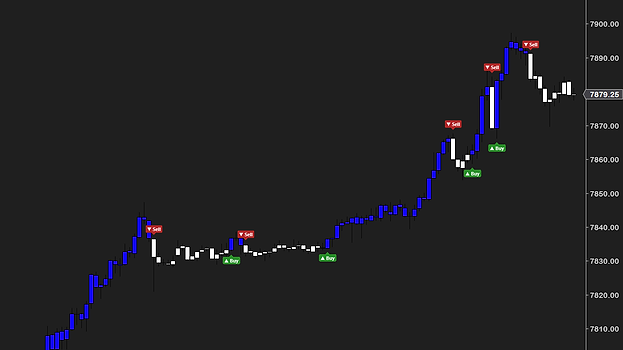
UT Bot Alerts indicator on a 2000-tick MES chart in NinjaTrader 8: the ATR trailing stop line in green under price and in red over it, a green Buy mark under each bar that closed up through the line and a red Sell mark over each bar that closed down through it UT Bot Alerts across three days of a 2000-tick MES chart: the trailing stop line through a sell-off and the rally after it, with small Buy and Sell signal marks at every change of side UT Bot Alerts on a 5-minute ES chart across three sessions, Buy and Sell marks at each change of side and the label beside the newest bar reading 33 bars and stop 7817.50 Paint bars on a 5-minute ES chart: closed bars in white while the stop is below price and in red while it is above, with the stop line and the Buy and Sell marks Marks set to text only on a 5-minute ES chart: the words Buy and Sell with their triangles in green and red, no box around them, and the label reading 34 bars and stop 7818.75 The label with every part switched on beside the newest bar of a 5-minute ES chart: 34 bars, stop 7818.75, 8 ticks away, +0.21% since flip, 11 flips in 100 bars UT Bot Alerts with the stop line white under price and red over it, on a 5-minute ES chart across three sessions, Buy and Sell marks at each change of side A 15-minute ES chart over four days with other symbols in the marks, a plus for Buy and a star for Sell, and the label reading 14 bars and stop 7813.00 A 1-minute ES chart in a decline with the marks in white boxes and black text: Sell marks at the turns down, Buy marks at the short turns up, the stop line red above price The trend filter on a 1-minute ES chart: its EMA drawn as a thin dashed gold line, Buy marks through the rally above it and only a few Sell marks
1 / 10

No repaintSound alerts5 outputs

The stop line trails the close by the ATR multiplier times the ATR. It moves only when a bar closes.
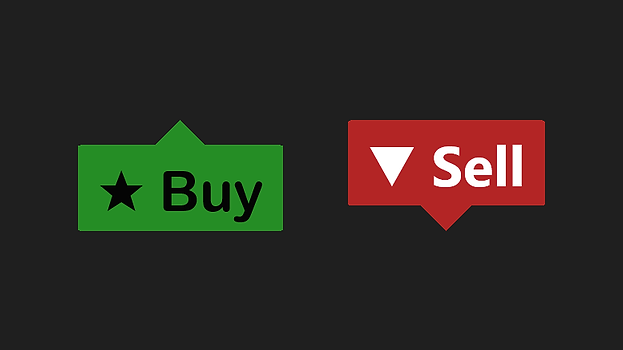
Buy mark: the bar closed up through the stop line. Made at the close, final.
Sell mark: the bar closed down through the stop line. With alerts on, each side has its own sound.
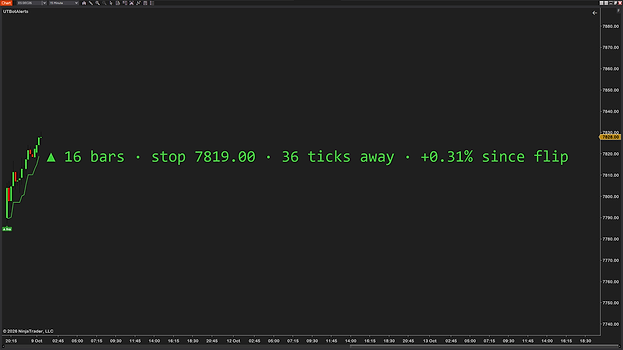
The label beside the newest bar: an arrow for the side, the bars since the flip and the stop price. Switches set what follows the arrow.

What it adds to a basic UT Bot indicator.

The signals Basic UT Bot UT Bot Alerts
ATR trailing stop a stop that trails the close and changes sides when a bar closes through it✓✓
Buy and Sell marks one at every change of side✓✓
ATR multiplier (key value) and ATR period the original’s two numbers, 1 and 10 by default✓✓
Signals from Heikin Ashi candles from Heikin Ashi prices, while your chart keeps its normal candles✓✓
Final, filtered, counted
Marks that never move a mark is made when its bar has closed, and stays✓
Trend filter Buys only above an EMA, Sells only below it✓
Flip count how often the stop changed sides in the last 100 closed bars✓
Reads the stop for you
The stop drawn as a line one line, under price or over it, in your colors✓
Alerts on Buy and Sell in real time, when a mark is made✓✓
A sound for each side and a cooldown plus a line in NinjaTrader’s Alerts Log✓
A label beside the newest bar side, bars since the flip, stop price, flip count; ticks and percent optional✓
Five outputs for strategies and the Market Analyzer Stop, Signal, Trend, Filter, TrendBars✓
Yours to set
Bar colors bars take the color of the stop’s side✓✓
Bodies, outlines or both paint the candle bodies, only their outlines, or both✓
Nine mark styles, ten symbols, your own word eight shapes or text only; font, colors and opacity for each side✓
Free, with free updates no trial, no locked settings, no license key✓✓
Works on
Chart types
Tickany count, see the note
Minuteany, up to daily
Volumeany size
Range, Renkoany size
Instruments
Futuresall exchanges
Stocksand ETFs
FX and cryptono volume needed
Data providerany
Needs
NinjaTrader 8recent version, free included
Dataprice only, no volume
Licensenone, nothing to activate
Machine IDnone

In short: NinjaTrader 8 and a chart. That is all UT Bot Alerts needs.

The stop needs a little history first: with the default settings the line appears about 20 bars into the chart. On bars with a range of only a tick or two, nearly every bar gets a mark: use bigger bars there.

Get UT Bot Alerts on your chart

You might ask: why is this free, what is the catch? There is none. We want to change the market for third-party NinjaTrader tools, and giving our work away is part of how we do it.

To say it plainly: this market is overpriced and full of low-quality tools with missing features and bugs. Vendors charge hundreds of dollars for simple indicators. No indicator, add-on or tool will make you profitable. A good one makes your trading environment better, and you know that already, or you would not be here looking.

Our goal is the highest-quality products we can build, tools that make a real difference on the chart. We get there by testing hard: weeks on live charts before release, feedback from the traders who use them, and a close read of what the forums complain about. We offer a full refund within 14 days, we adapt tools for customers who ask, and we give most of our work away.

Most of our tools are free for a reason. We want you to try them, see the quality and the features for yourself, and not spend a dollar with us until you think a tool deserves it. We are a business and we intend to make money, by solving real problems for traders.

So yes, UT Bot Alerts is completely free, no strings attached. If you like it, there are more free tools and paid ones priced well under what is usual in this market. If you have any questions, please email us at support@usefulindicators.com.

Free download

$0/forever

No card, no license key, no expiry. Nothing to cancel because nothing was started.

Download free
Included:
  • Every setting, every mark style, all five outputs
  • Free updates
  • Support by email — answered within a day
  • Same install as the paid tools — one zip, one import
  • No license server, no machine ID

Delivered by Creem. The download link lands on the next page and in your email.

How traders use it

Four ways to use one trailing stop. A mark says where the stop changed sides, nothing more; the entries, the exits and the discipline are still yours.

DirectionThe side check

A green line under price or a red line over it: one glance says which side the stop is on. Some traders take trades only in that direction and stand aside while the line keeps flipping.

ExitThe trailing stop

The line trails the close by a multiple of the ATR and moves only when a bar closes. The label beside the newest bar prints the stop’s price, so the level is in view without reading it off the scale. It draws the level; it places and moves no order.

FilterThe trend filter

With the trend filter on, a Buy is marked only above the EMA and a Sell only below it. Fewer marks against the larger move, while the line and the label still show the true side.

ChopThe flip count

The label counts how often the stop changed sides in the last 100 closed bars. A high number says the stop is too tight for this chart: raise the ATR multiplier or use bigger bars.

New to ATR trailing stops? Read our SuperTrend guide, a close relative →

Frequent questions.

Can’t find the answer to your question? Email us, we answer fast.

Download the zip, then in NinjaTrader 8 go to Tools → Import → NinjaScript Add-On and pick the file. Add UT Bot Alerts to any chart from the Indicators window (it is UTBotAlerts, one word, in the list) and the stop line and the Buy and Sell marks are there — it takes about a minute. The step-by-step guide covers every message NinjaTrader can show and how to update.

Genuinely free — no trial period, no locked settings, no license key, nothing to upgrade to. The download button opens a $0 checkout that asks for your name and email, no card; the download link arrives by email within minutes. News emails come only if you check the optional Insider list box at checkout. We sell other indicators; free tools like this one are how we show you the quality of the work first.

UT Bot Alerts is an ATR trailing stop indicator. It draws a stop line that trails the close by a multiple of the ATR (the average true range, the average size of a bar), and it marks a Buy signal on the bar that closes up through that line and a Sell signal on the bar that closes down through it. This is our own version for NinjaTrader 8 (NT8): free, with alerts, a trend filter and outputs for strategies. Despite the name it is not a trading bot — it is an indicator, and it places no orders.

No. It is non-repainting by design: a Buy or Sell mark is made when its bar has closed and never moves afterward, and the stop line moves only when a bar closes, never inside one. Alerts follow the same rule: one alert for a bar that has just closed. That holds on every Calculate setting, On each tick included. One thing to know: Renko and Line Break charts take their newest bar away and build it again while it forms. Marks sit on closed bars only, so that moves no mark. (If a chart ever rewrites a bar after it has closed, the mark is redrawn for the bar as it then stands.)

It is the same method: a stop that trails the close by a multiple of the ATR and changes sides when a bar closes through it, with the original’s two numbers as defaults (key value 1, ATR period 10) and its Heikin Ashi option. The code is our own, written for NinjaTrader 8. Marks can still differ from a TradingView chart of the same market, because the data feed, the session hours, the bar boundaries and the amount of history loaded differ. We handle a few rare edge cases our own way. The main one: a close exactly on the stop line counts as a close through it, in both directions, unless the bar before closed on the line too. One difference you can see: the original shows marks and colored bars only, and this version also draws the stop as a line. The original script was published by QuantNomad, who credits Yo_adriiiiaan and HPotter for the earlier work; we are not affiliated with them or with TradingView.

It marks Buy and Sell signals, and it is plain about what they are. A Buy signal is the bar where the trailing stop changed to the long side: the bar closed up through the stop line. A Sell signal is the reverse. That is a fact about the bars behind you, not a forecast: a trailing stop flips often in a sideways market, and no setting removes that. Use the signals as one input; the entries, the exits and the risk stay yours.

Yes — tick, minute, volume, range and Renko charts, and daily bars; any instrument, any data provider. It needs no volume data. Two things to know: the stop needs a little history first (with the default settings the line appears about 20 bars into the chart), and on bars with a range of only a tick or two, nearly every bar gets a mark — use bigger bars there.

There is no best pair of numbers, and we won’t pretend there is. The defaults are the original’s: ATR multiplier (key value) 1 and ATR period 10. A higher multiplier puts the stop further from the close and gives fewer signals; decimals such as 0.5 or 1.5 work. The same two numbers do not behave the same on a 1-minute scalping chart as on a 5- or 15-minute chart: smaller bars have a smaller ATR, so the stop sits closer to price. The label helps you judge: its flip count says how often the stop changed sides in the last 100 closed bars, and if that is too many, raise the multiplier or use bigger bars. The label needs free space to the right of the newest bar; with too little it shows only what fits, and the flip count is the first part to go — widen the chart’s Right side margin (right-click the chart → Properties).

UT Bot Alerts has 47 settings in eight groups of its properties panel, covered here under six headings. The names in bold are the names you will see there.

UT Bot settings: key value, ATR period, Heikin Ashi

ATR multiplier (key value) sets how far the stop sits from the close, counted in ATRs: 1 by default, from 0.1 to 20. A higher number means fewer signals. ATR period is how many bars the ATR looks back: 10 by default, from 1 to 500. Both defaults are the original’s numbers. Signals from Heikin Ashi candles (off by default) takes the signals from Heikin Ashi prices while your chart keeps its normal candles: smoother, and it moves the marks.

Trend filter with an EMA

Use trend filter (off by default) marks a Buy only when the bar closes above a moving average and a Sell only when it closes below it; a change of side against the average gets no mark and no alert. EMA period sets that average, 100 by default, and Show EMA line (on by default) draws it while the filter is on. The stop line, the label and the bar colors are not filtered: they follow the true side.

ATR trailing stop line and bar colors

Show stop line draws the trailing stop, which moves only when a bar closes. Up color (lime green) shows while the stop is below price and Down color (red) while it is above; Line width and Line style finish the look. Paint bars (off by default) colors every closed bar by the stop’s side, with an Up color and a Down color of its own, and Paint chooses Bodies, Outlines or Both.

Buy and Sell signals: shape, symbol, text

Show Buy marks and Show Sell marks print a mark at the bar that closed on or through the stop line; it is made when the bar has closed and is final. Each side has its own Shape (eight shapes, or text only), Symbol (ten, or none), Text of up to 12 characters, font and colors, Opacity (%) and Distance from bar (px).

A label with the stop price and the flip count

Show label puts a short text beside the newest bar, at the height of the stop line. Show bars since flip, Show stop price and Show flip count are on by default; Show distance to stop, in ticks, and Show % since flip are off. The flip count is how often the stop changed sides in the last 100 closed bars. Font and Label distance (px) set the label’s look and its place. With little free space beside the newest bar, the label shows only what fits.

Alerts with a sound for each side

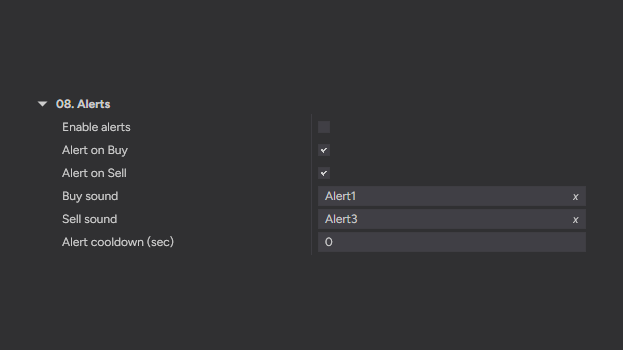
Enable alerts (off by default) plays a sound and adds a line to NinjaTrader’s Alerts Log when a Buy or Sell is marked, in real time only; on intraday charts a session’s last bar before a break stays quiet. Alert on Buy and Alert on Sell switch each side. Buy sound and Sell sound take any .wav file, NinjaTrader’s Alert1 and Alert3 by default. Alert cooldown (sec), 0 by default, is a pause before the same side can alert again.

Alerts are off until you switch on Enable alerts. From then on a marked Buy or Sell plays a sound and adds a line to NinjaTrader’s Alerts Log with the bar’s close and the new stop. Each side has its own switch and its own sound: NinjaTrader’s Alert1 for a Buy and Alert3 for a Sell by default, or any sound file (.wav) you pick. Alerts come in real time only, once for a bar that has just closed — nothing sounds while the chart loads its history. One bar stays quiet on intraday charts: the last bar of a session that is followed by a break. NinjaTrader reports that bar’s close only when the next session opens, and by then it is old. Daily bars alert as usual. Alert cooldown (sec) sets a pause before the same side can alert again. To open the log: Control Center → New → Alerts Log.

Not from the tool itself: it plays a sound on the PC and writes a line to NinjaTrader’s Alerts Log, and it sends nothing off the PC. For an email or a text message, NinjaTrader has its own alert builder (right-click the chart → Alerts): it can watch this indicator’s Signal output — 1 for a Buy, -1 for a Sell — and share a message through a Share service that you set up in NinjaTrader’s options (Tools → Options). That part is NinjaTrader’s own, so set it up and test it there.

With Use trend filter on, a Buy is marked and alerted only when the bar closes above a moving average, and a Sell only when it closes below it. The average is an EMA, 100 bars by default (EMA period). A flip against it gets no mark and no alert. The stop line, the label and the bar colors still follow the true side, so the line can change color on a bar without a mark. Show EMA line (on by default) draws the average on the chart while the filter is on; its color, width and style are in the Filter row under Plots.

Yes. Signals from Heikin Ashi candles takes the signals from Heikin Ashi prices while your chart keeps its normal candles, so the chart type stays as it is. It is smoother, and it moves the marks: Heikin Ashi prices are not traded prices, so a mark can print at a price you could not have been filled at. On NinjaTrader’s own Heikin Ashi bar type (NinjaTrader spells it Heiken Ashi) the bars already are Heikin Ashi, and the switch changes nothing there.

Yes. It has five outputs, in this order: Stop (the line’s price), Signal (1 on a bar that closed with a Buy mark, -1 with a Sell mark, otherwise 0), Trend (1 while the stop is below price, -1 while it is above), Filter (the trend filter’s EMA) and TrendBars (how many bars the side has lasted). In a strategy — your own code or NinjaTrader’s Strategy Builder — test Signal with equals at 0 bars ago, not with a cross: the value is there for one update only, right after its bar closed, live and in a backtest. In a Market Analyzer column, keep Calculate set to On bar close. With Calculate set to On each tick or On price change, the Trend, Filter and TrendBars outputs at 0 bars ago are live and can change back before the bar closes, and Stop at 0 bars ago is the chart’s line only until price goes through it inside the bar: from there it follows price, so do not rest an order on it. Signal is never live: closed bars only. The indicator’s own description in NinjaTrader repeats these rules.

Both are ATR trailing stops that change sides when a bar closes through them. The difference is where the stop is measured from: UT Bot trails the close by its multiplier times the ATR, while SuperTrend builds its line from the middle of the bar (the high plus the low, divided by two) plus or minus its multiplier times the ATR. With the same numbers the two lines sit in different places and flip on different bars. Both are free here: our SuperTrend indicator has an ADX filter against chop, UT Bot Alerts an EMA trend filter.

The bars are too small for the stop. Where a bar’s average range is only a tick or two — tick charts with only a few trades per bar, or a 1-minute chart of bonds or of a low-priced stock — the stop sits within a tick of the close and nearly every price change crosses it. Use bigger bars, or raise the ATR multiplier. The flip count in the label shows the effect.

It’s built lean: every closed bar is calculated once, and the work for each new bar and each trade stays the same however long the chart is. One thing to know: a chart squeezed to show thousands of bars at once still draws every mark in view — switch the marks off there if it feels heavy. If your chart ever lags with it on at a normal zoom, email us: that’s a bug, not normal.

Email support, answered by the traders who built it. Bugs get fixed — this tool gets the same updates and support as our paid indicators.

See the stop on your own chart.

Free, no card, no license key. Download it, import it, and the stop line and its marks are on your chart in about a minute.

Not for you if you expect the Buy and Sell marks to be trade advice. UT Bot Alerts marks where a trailing stop changed sides; the decision, and the trade, are yours.

Pairs well with Free SuperTrend indicator (ATR trailing stop line) · Risk reward tool for Chart Trader (ATM Risk Reward) · Multi-timeframe trend indicator (MultiTrend)

We also offer custom builds

Can’t find the tool you need? We’ll build it.

Tell us what you want to see on the chart. You get a fixed price and a written plan before any work starts.

Request a free quote

Every tool on this site started as an idea like yours.

A key levels indicator we built, on a NinjaTrader chart A moving-average zones indicator we built, on a NinjaTrader chart A VWAP indicator we built, on a NinjaTrader chart