How to Change Candlestick Colors in NinjaTrader 8
Changing candle colors in NinjaTrader 8 is quick once you know which panel they live in. Here is every setting the platform gives you, named as it appears on screen — and the one limit no amount of clicking gets past.
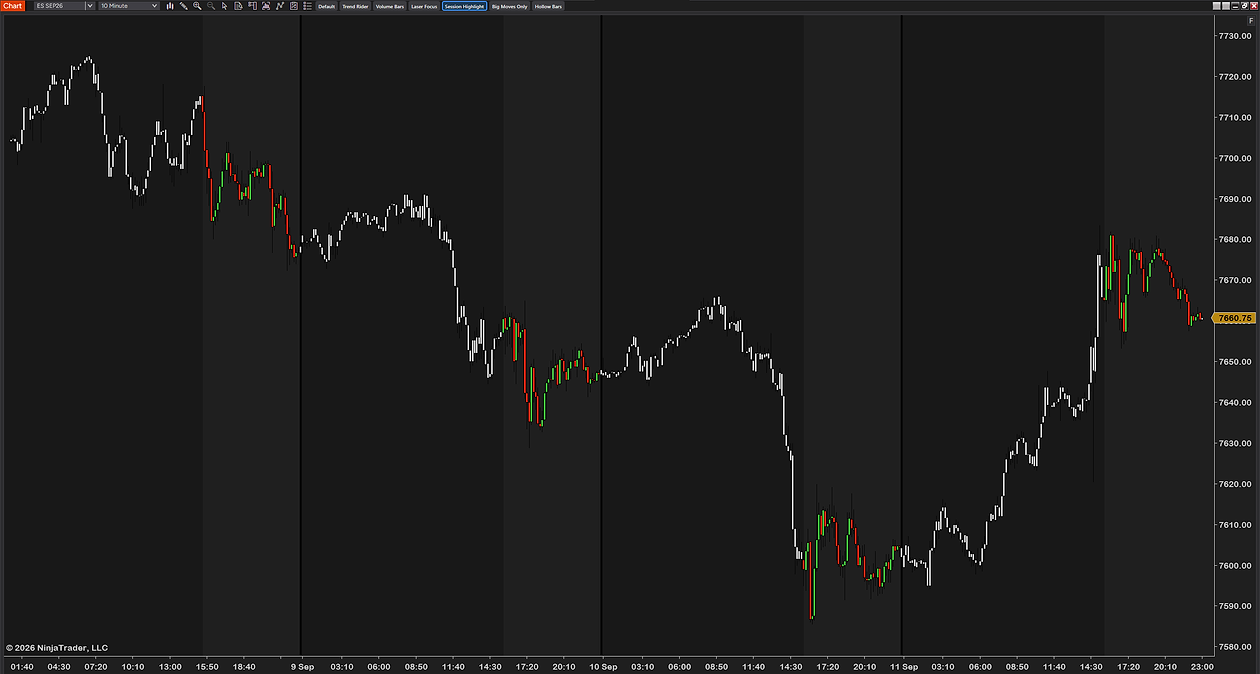
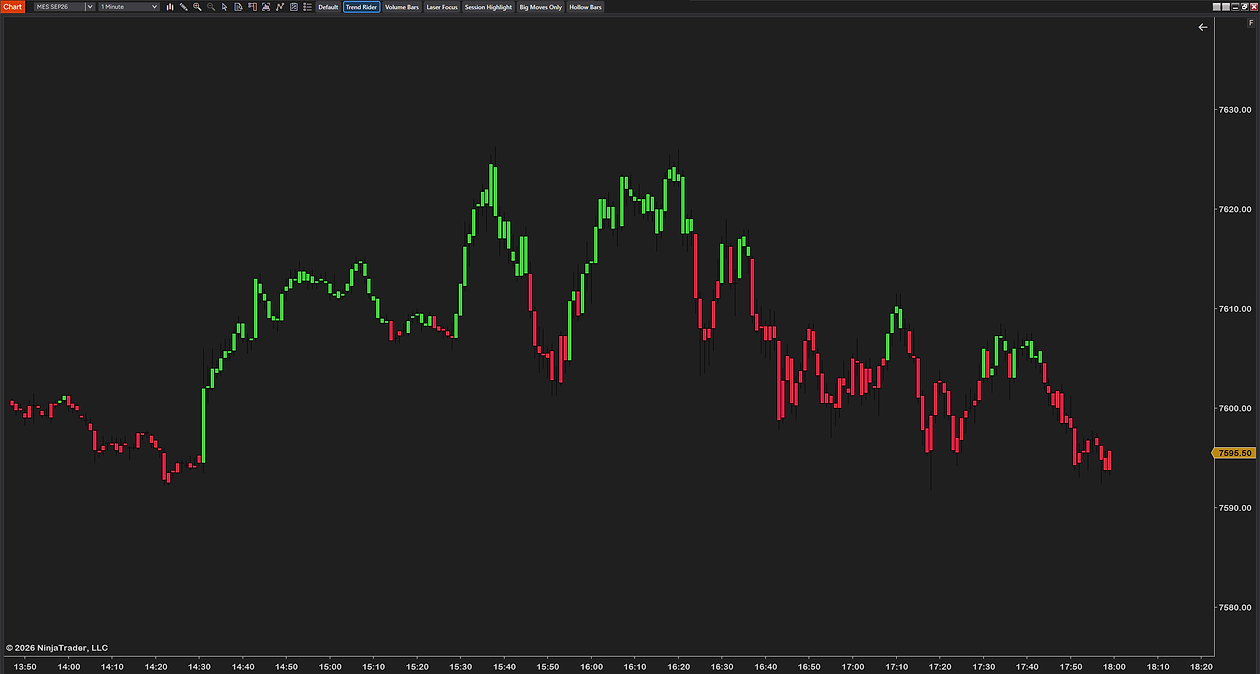
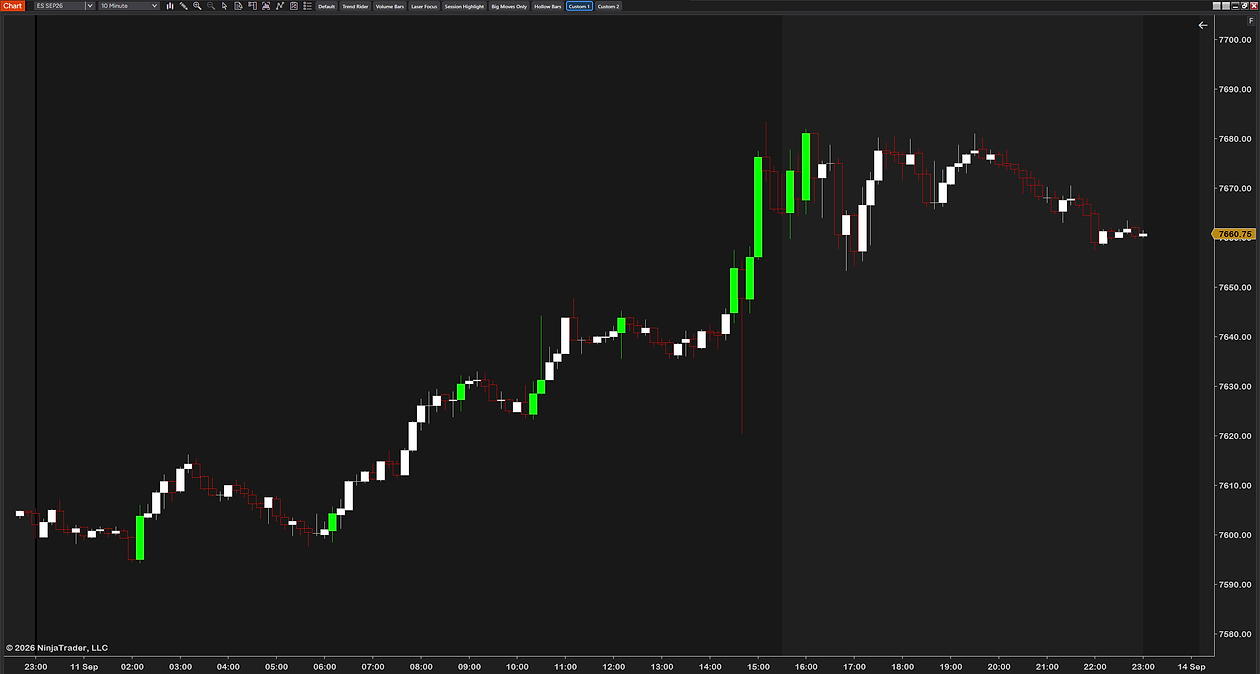
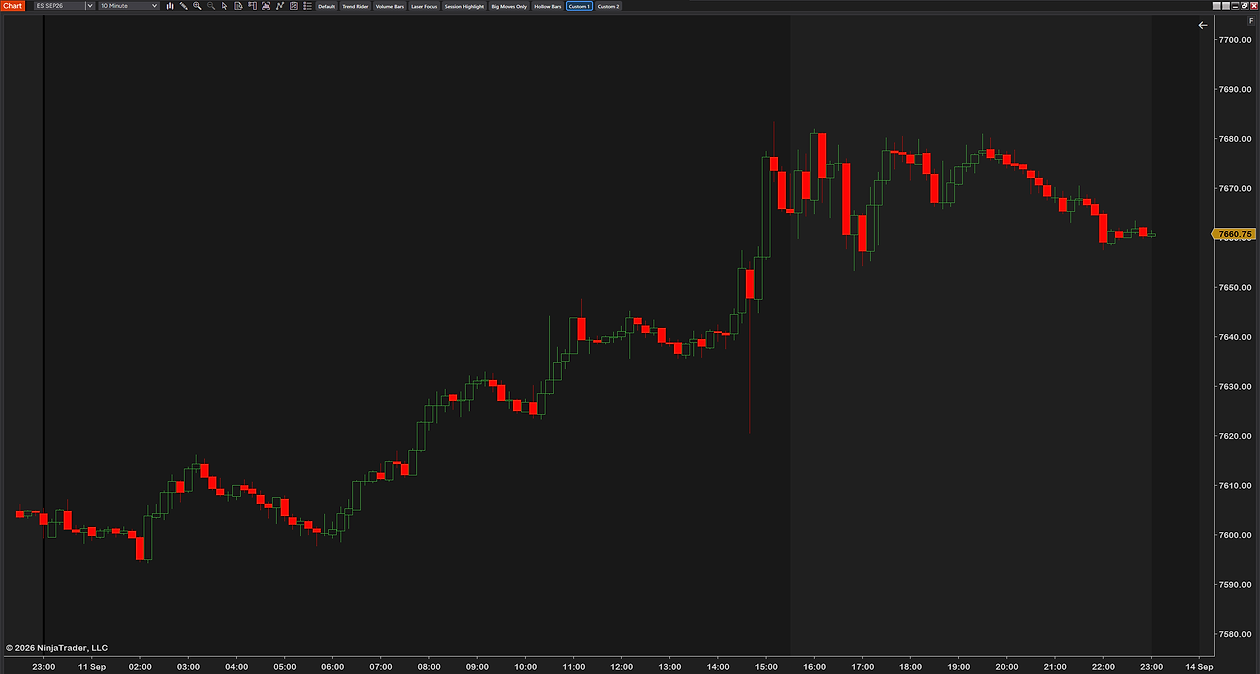
Where the candle colors live
They are not in chart properties, which is where most people look first. They belong to the chart style, and the chart style lives inside the Data Series window.
- Right-click anywhere on the chart and choose Data Series…
- In the properties panel on the right, find the Chart style section.
- Set the style to Candlestick if it is not already, and the color settings appear underneath it.
- Change what you want and click OK. The chart redraws immediately.
One thing worth knowing before you start: these settings belong to the chart style on this data series. They are not a global theme, so a second chart gets its own copy.

Every setting NinjaTrader gives you
This is the complete set for the Candlestick style, named exactly as the labels read on screen, so you can tell at a glance whether you have missed one.
| Setting | What it controls |
|---|---|
| Color for up bars | The body fill when the close is at or above the open |
| Color for down bars | The body fill when the close is below the open |
| Candle body outline | The line around the body — color, thickness and dash pattern |
| Candle wick | The upper and lower wick — color, thickness and dash pattern |
| Wick matches body | When on, the wick takes the up or down body color instead of its own |
| Wick style and width | The wick's line style and thickness, set separately from the outline |
| Doji color | The color used when open and close are equal |
| Bar width | How wide each candle is drawn |
That is more control than most people realize they have. The two that get missed most often are Wick matches body — which is what you want if you dislike wicks in a different color from the candle — and the separate doji color, which only shows up on bars where open and close land on the same price.
The chart styles you can choose
Candlestick is one of several drawing styles, and switching style changes which color settings you get. NinjaTrader 8 ships these:
Candlestick · Hollow candlestick · OHLC · Open/Close · Box · Line on Close · Mountain · Equivolume · Heiken Ashi · Kagi Line · Point and Figure
If a setting you read about somewhere is not in your panel, the usual reason is that you are on a different style. Equivolume, Kagi and Point and Figure in particular draw bars on completely different rules and expose different options.
Hollow candles are a style, not a color
People often go hunting for a “hollow” or “outline only” checkbox among the color settings. There is not one. Hollow candlestick is its own chart style — you switch to it in the same Chart style dropdown, and then set its colors.
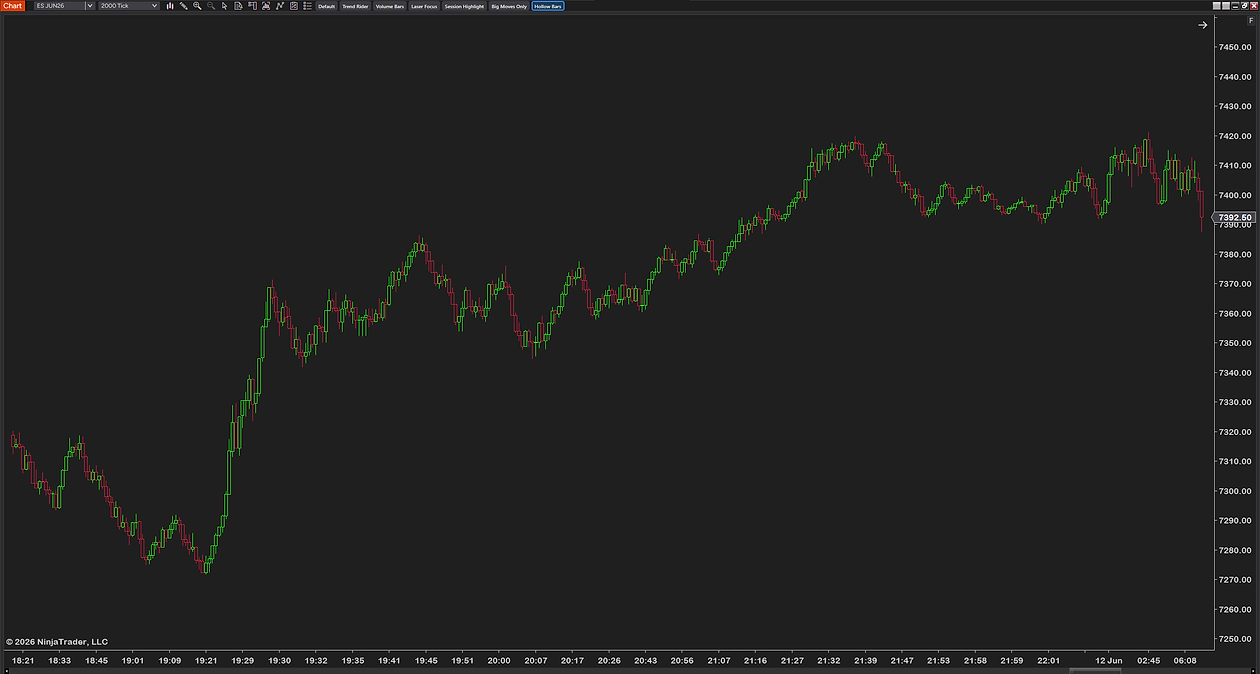
It is worth trying if you find solid bodies heavy: hollow candles show direction through the outline and fill only when the bar closes against the prevailing direction, which many traders find easier to read at a glance on a busy chart.
The one thing the built-in settings cannot do
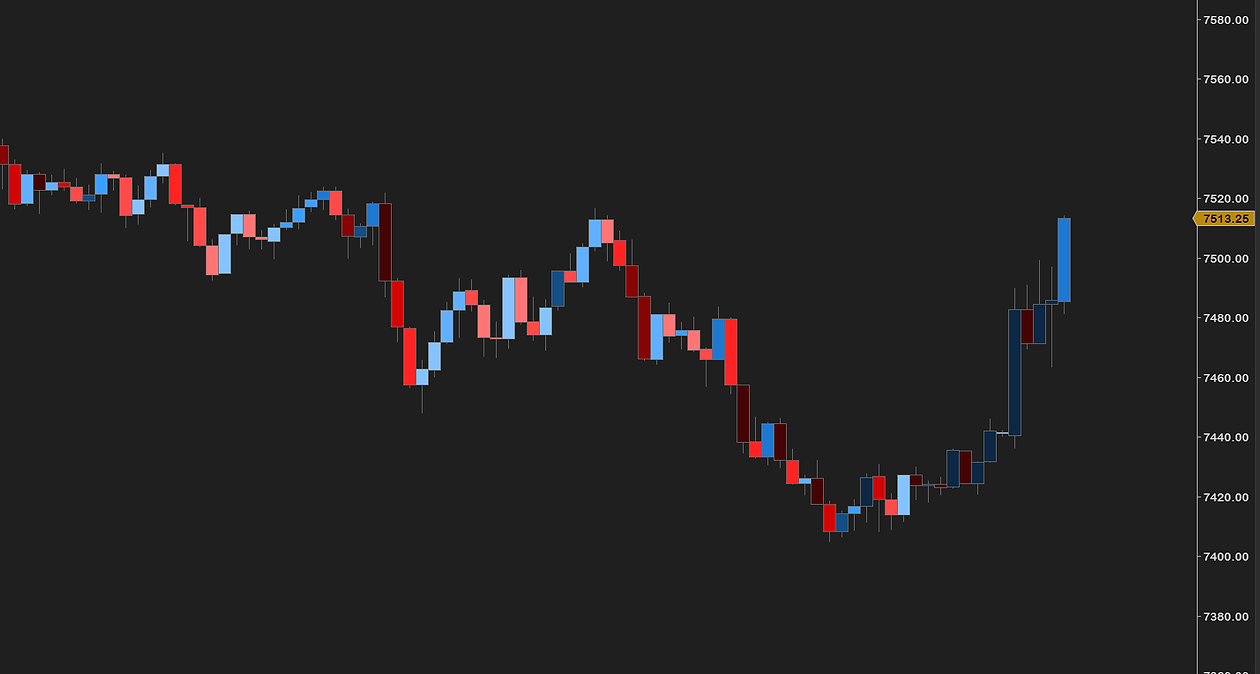
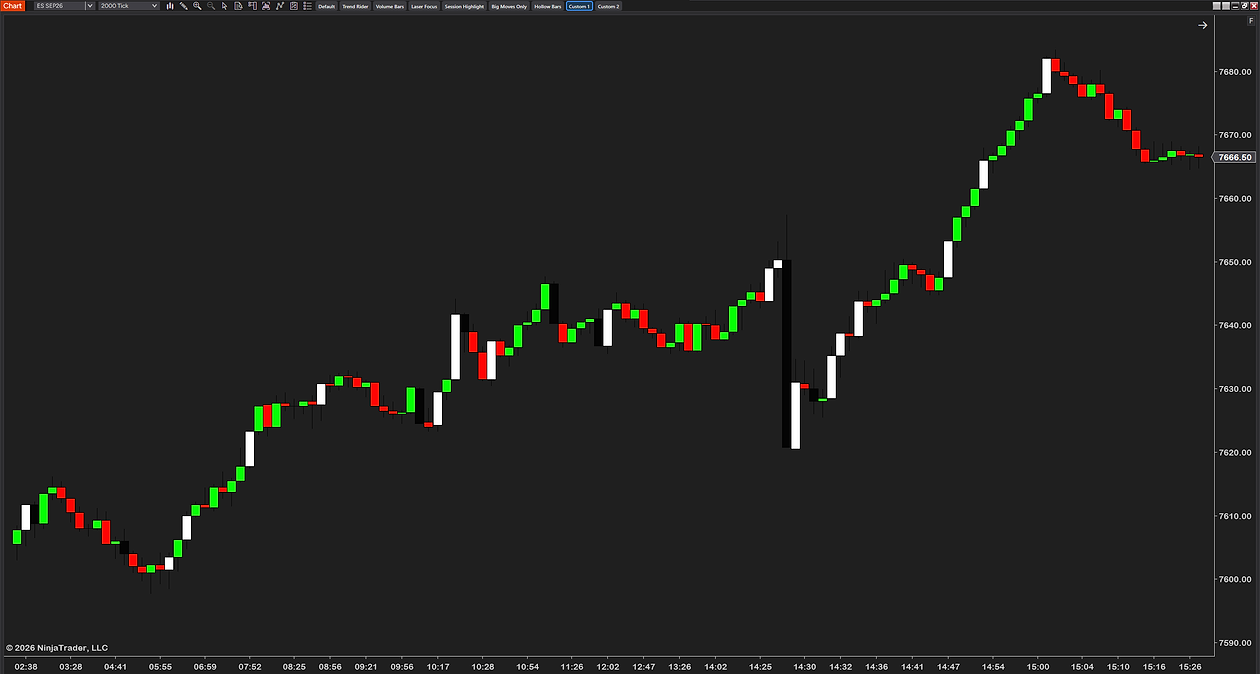
Every setting above answers the same question: did this bar close up or down? Up bars get one color, down bars get the other, and that rule is fixed. It cannot be changed, and no combination of the settings gets past it.
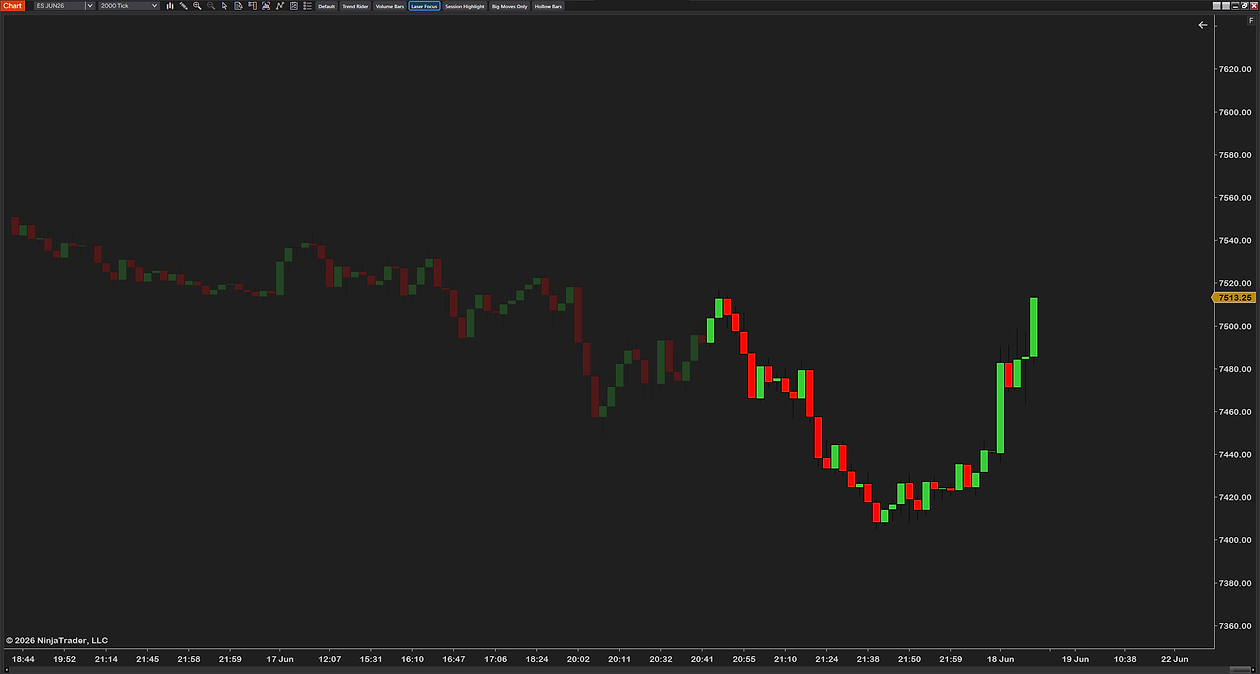
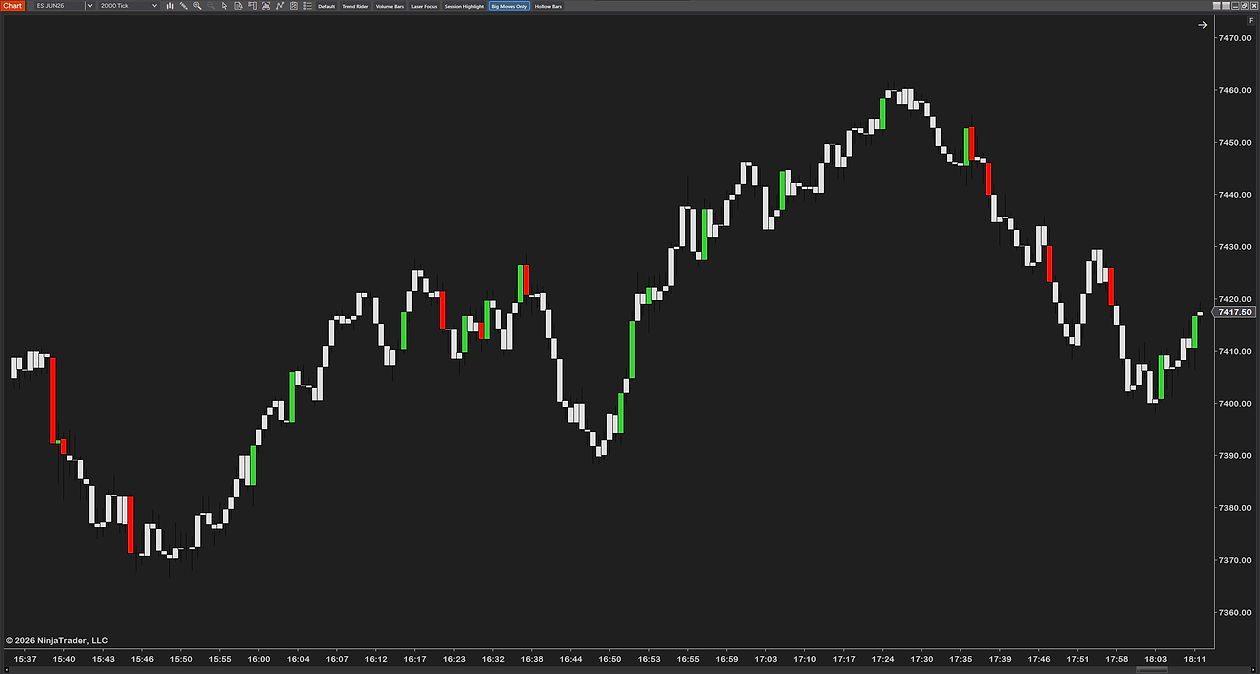
What you cannot do natively is color a candle by what the market is doing:
- By trend. Shade bars one way while price is above a moving average and another way below it.
- By volume. Make heavily traded bars stand out from thin ones.
- By size. Highlight only the bars that traveled more than a set number of points or a multiple of ATR.
- By session. Give the overnight bars their own color so the regular session reads separately.
Saving a look is possible, with a catch. Right-click the chart, hover Templates and choose Save As, and NinjaTrader stores the chart properties — chart style and its colors included — along with your indicators and data series settings. Templates → Load brings it back.
The catch is that a template carries the whole chart, not just the candles. Loading one to change your colors also replaces the indicators and settings that came with it, which is why templates work well for setting up a new chart and badly as a way to flip between two color schemes while you are trading.

Coloring candles by what the market is doing
Getting past that ceiling means adding a NinjaScript tool that takes over how the candle is drawn. Nothing about your data changes — same bars, same prices, same spacing — only the presentation.
What a good one adds over the native settings:
- Rules instead of fixed up and down colors — trend, volume, bar size, session.
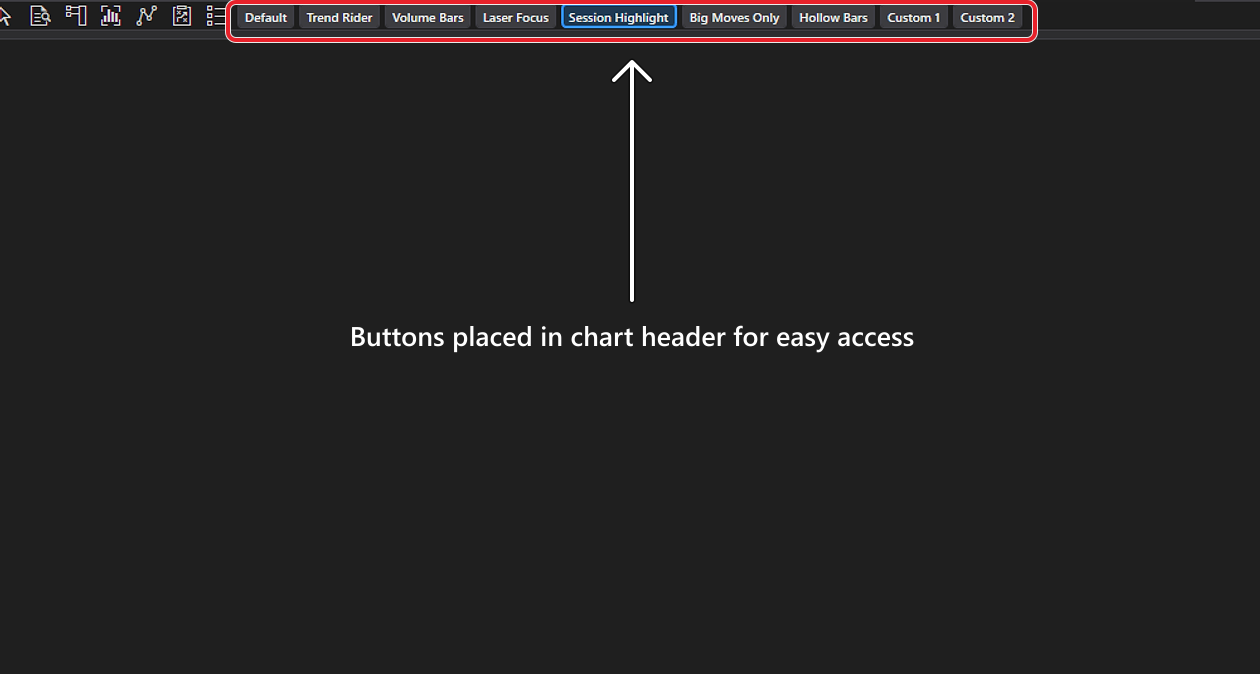
- Looks you can switch between in one click, carrying only the candle styling rather than the whole chart the way a template does.
- Separate up and down outlines, which the native single outline color does not allow.
Our own free candlestick color add-on does all three and is free to download.
How to install a candle-styling add-on
- Download the free candlestick color add-on — keep it zipped.
- Open the Control Center → Tools → Import → NinjaScript Add-On… and select the .zip. NinjaTrader documents the process in its import guide, and we walk through every step, error message and the update rule on our installation page.
- On a chart, right-click → Indicators…, add it, and pick your look.
Common questions
How do I change candlestick colors in NinjaTrader 8?
Right-click the chart and choose Data Series. In the properties panel on the right, under the chart style, you will find Color for up bars, Color for down bars, Candle body outline and Candle wick. Change them and click OK; the chart redraws immediately.
Why can't I find the candle color settings?
They are not in chart properties, which is where most people look. They belong to the chart style inside the Data Series window. If the settings you expect are missing, check the Chart style dropdown is set to Candlestick — other styles such as Equivolume, Kagi and Point and Figure expose different options.
Can I make the wick the same color as the candle body?
Yes. There is a "Wick matches body" option in the same panel. Turn it on and the wick takes the up or down body color instead of its own.
How do I get hollow candles in NinjaTrader 8?
Hollow candlestick is its own chart style rather than a color setting. Switch the Chart style dropdown from Candlestick to Hollow candlestick, then set its colors in the same panel.
Can I color candles by trend or volume in NinjaTrader 8?
Not with the built-in settings. The native colors answer one question only — did the bar close up or down — and that rule is fixed. Coloring by a moving-average trend, by volume, by bar size or by session needs a NinjaScript add-on that takes over how the candle is drawn.
Can I save a candle color scheme and switch between looks?
Partly. Right-click the chart, hover Templates and choose Save As to store the chart properties, including the chart style and its colors, then Templates and Load to bring it back. The catch is that a template carries the whole chart — indicators and data series settings too — so it suits setting up a new chart rather than flipping between color schemes mid-session.
Do candle colors change my data?
No. Chart style settings are presentation only. The bars, prices, width and spacing are unchanged; only how they are drawn differs.
Related guides
- EMA clouds and moving-average ribbons — the other common way of showing trend through color rather than lines.
- The bar timer and countdown — another chart-presentation setting people hunt for and cannot find.
- Why a NinjaTrader chart lags — worth reading before blaming your chart styling for a slow chart.
The honest part
Candle colors will not make you money. What they do is reduce the effort of reading your own chart — and if you stare at one for six hours a day, that is not nothing. Set them so the information you actually use stands out, and leave the rest alone.