CurrentPriceLine

Free
Free download NinjaTrader 8 Indicator

Current price line for NinjaTrader 8: price label, up/down colors, session stats, bid and ask lines

No machine ID No license server Never touches orders Instant download Free updates Verified on NinjaTrader 8.1.8.2 · 22 Sep 2026
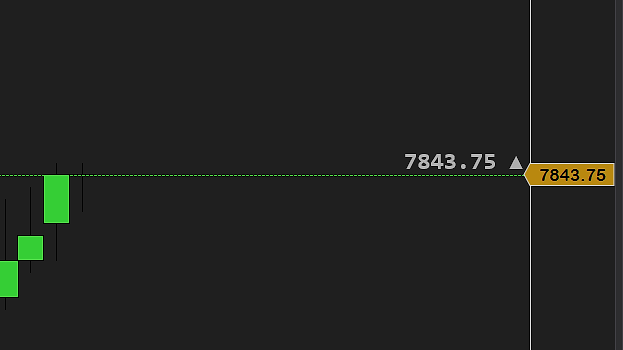
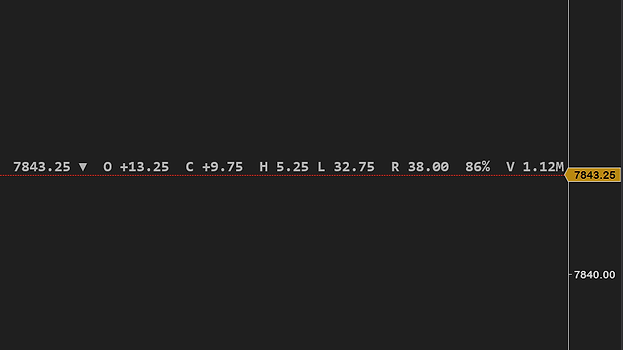
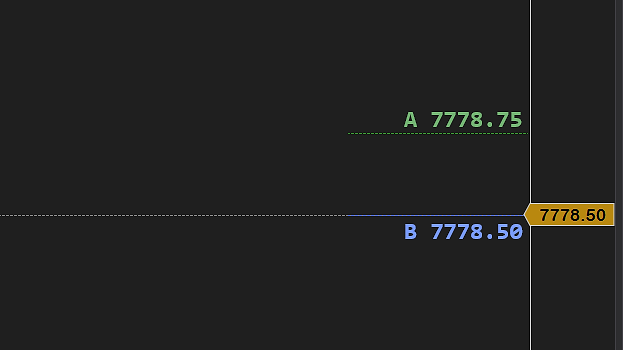
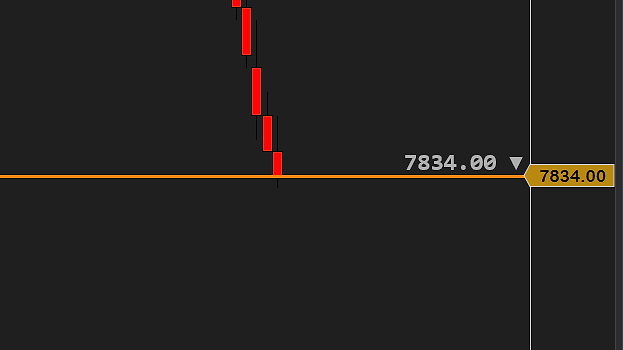
A 2000-tick ES chart in NinjaTrader 8 with CurrentPriceLine at its defaults: a gray dashed line across the chart at the last price, 7843.75 and an up triangle in small gray text above the line at the right end, next to the price scale The same chart in Up_Down_By_Tick mode after a rise: the line green, the label 7843.75 with an up triangle in gray above it at the right end Every label statistic on, after a fall: a red line and the label 7843.25, a down triangle, O +13.25, C +9.75, H 5.25 L 32.75, R 38.00, 86% and V 1.12M A 60-minute ES chart over three weeks with a green line and the label 7843.00, an up triangle, O +13.00 and C +9.50: the move since the session open and vs the previous close, in points The same 60-minute chart with a red line and the label 7844.50, a down triangle, O +0.185% and C +0.140%: the same two moves shown in percent A 15-minute ES chart with the label 7844.50, a down triangle, O +0.185% and C +0.140% sitting in a gray box above the line, next to the price scale A 5-minute ES chart over a whole trading day with a faint line at 7842.00 and a small label reading 7842.00 with a down triangle at the right end The bid and ask lines on a 5-minute ES chart: a green ask line labeled A 7835.25 next to the price label 7835.25 with an up triangle, and a blue bid line labeled B 7835.00 just below it A custom look on a 2000-tick chart: a thick solid orange line across the whole chart at 7834.00 with the label 7834.00 and a down triangle at the right end Line length set to Right_Of_Last_Bar_Only: an orange line that starts at the last bar and runs to the price scale, labeled 7834.25 with a down triangle
1 / 10

What CurrentPriceLine adds to NinjaTrader 8’s own price line.

0:00 / 0:00
Works on
Chart types
Tickany count
Minuteany, daily too
Volume, Rangeany size
Renko, Heikin-Ashiline and label; the session-open pieces stay off
Instruments
Futuresall exchanges
Stocksand ETFs, with percent units
FX and cryptoanything NinjaTrader charts
Data providerany
Needs
NinjaTrader 88.1.8.2, free tier included
Dataa live or delayed feed; quotes for the bid/ask lines
Licensenone, nothing to activate
Machine IDnone

In short: NinjaTrader 8 and a chart with a data feed. That is all CurrentPriceLine needs.

The session pieces of the label come from the bars, so load whole days: the session open and the session volume only show when the loaded history covers the session from its start.

What CurrentPriceLine puts on a NinjaTrader 8 chart.

Thirty-three settings in five groups, and the six things they add up to. The names in bold are the names in the indicator’s panel.

The current price line, in five color modes

A horizontal line across the chart at the current price, on any bar type. Line color changes is Static_Color (one color), Up_Down_By_Tick (the Up color after a rise, the Down color after a fall), Flash_On_Tick, Above_Below_Session_Open or Hit_Ask_Or_Bid. The price line color is Line color; Line style (solid, dashed or dotted), Line width (1 to 5 px) and Line opacity (%) are yours; Line length runs it across the whole chart or only right of the last bar.

A price label that says how old the price is

Show price label puts the price at the right end of the line, beside NinjaTrader’s own price marker on the scale, with an up/down triangle; Label position and Label placement move it to the left end or the current bar, above, below or on the line. Show age when price stops updating adds 45s, 3m, 2h once the last trade is more than ten seconds old; (stale), (outside session) and (no feed) show even with the label off.

The session in the label: open, close, range, volume

Six switches under Label Information: Show move since session open (O +3.25), Show move vs previous close (C +8.50 — the net change, from the settlement on futures, the figure NinjaTrader’s own Net Change columns use), Show distance to session high and low (H 12.50 L 30.25), Show session range (R 42.75), Show position in session range (62%) and Show session volume (V 412k), on the session your Trading Hours template defines.

Bid and ask lines that follow the quote

Show bid and ask draws short bid and ask lines next to the price scale, from the quote itself rather than the last trade, and Show bid/ask prices prints each price beside its line. Bid line color and style and Ask line color and style set color, dash style, width and opacity; Hide when zoomed out takes both away when they would sit on top of the price line.

Follows the last price, or another indicator

Line follows is Last_Price by default. Set it to Another_Indicator, pick that indicator under Input series at the top of the dialog and set Panel to its panel, and the line, the label and the triangle track its live value — cumulative delta or VWAP are the usual choices — recomputed on every trade. In that mode the bid and ask lines and the session statistics stay off: an indicator has neither a quote nor a traded price.

Points, ticks or percent, on any chart type

Moves and distances shown in Points, Ticks or Percent (percent suits stocks; the range position is always a percent, the volume a count). Tick, minute, volume, range and daily charts all work, and a second copy can follow another indicator on its own panel. Renko, Heikin-Ashi, Line Break, Kagi and Point & Figure bars carry a constructed open, so the move since the open stays hidden there, and the Above_Below_Session_Open color mode says (no open).

Get CurrentPriceLine on your chart

You might ask: why is this free, what is the catch? There is none. We want to change the market for third-party NinjaTrader tools, and giving our work away is part of how we do it.

To say it plainly: this market is overpriced and full of low-quality tools with missing features and bugs. Vendors charge hundreds of dollars for simple indicators. No indicator, add-on or tool will make you profitable. A good one makes your trading environment better, and you know that already, or you would not be here looking.

Our goal is the highest-quality products we can build, tools that make a real difference on the chart. We get there by testing hard: weeks on live charts before release, feedback from the traders who use them, and a close read of what the forums complain about. We offer a full refund within 14 days, we adapt tools for customers who ask, and we give most of our work away.

Most of our tools are free for a reason. We want you to try them, see the quality and the features for yourself, and not spend a dollar with us until you think a tool deserves it. We are a business and we intend to make money, by solving real problems for traders.

So yes, CurrentPriceLine is completely free, no strings attached. If you like it, there are more free tools and paid ones priced well under what is usual in this market. Leave a review if you want to, good or bad, we read every one. If you have any questions, please email us at [email protected].

Free download

$0/forever

No card, no license key, no expiry. Nothing to cancel because nothing was started.

Download free
Included:
  • Every setting: 5 color modes, the full label, bid and ask lines
  • Free updates
  • Support by email, from the traders who built it
  • One zip, one import — the same install as our paid tools
  • Install it on every computer you use

Delivered by Creem. The download link lands on the next page and in your email.

How traders use it

Four ways traders use the line. None of them is a trade signal: CurrentPriceLine shows the price your feed reports, its direction and the session around it, and nothing more.

ScalpingThe number you already look at

The last price, its direction and the move since the open sit at the right edge, where your eye goes anyway. No data box to open, nothing to hover.

Quiet tapeIs it me or the market?

Price has not moved. The label reads 3m with no warning: the market is quiet. It reads (no feed): your connection dropped, not the tape.

LevelsDistance to the extremes

H 12.50 L 30.25 is how far price sits under the session high and over its low, and 62% is the same thing as a fraction of the range, without dragging a ruler.

Other panelsA live readout for any indicator

Set Line follows to another indicator — cumulative delta or VWAP — and the line, the label and the arrow track its live value on that panel.

More tools that cost nothing? See every free indicator and add-on →

Frequent questions.

Question or idea for improvement? Email us. We reply fast.

Genuinely free — no trial period, no locked settings, no license key, nothing to upgrade to. We sell other indicators; free tools like this one are how we show you the quality of the work first.

NinjaTrader 8 ships its own Price Line indicator: right-click the chart → Indicators → Price Line, and it draws a plain line at the last price, with optional bid and ask lines and no label. CurrentPriceLine is added the same way (Indicators → CurrentPriceLine, after the one-time import) and gives you the line plus everything the built-in one leaves out: the price and its direction next to the scale, how old the price is, five color modes, the session statistics, and bid and ask lines with their prices. Both can run on the same chart; most traders switch the built-in one off once this one is on.

Download the zip, then in NinjaTrader 8 go to Tools → Import → NinjaScript Add-On and pick the file. Add CurrentPriceLine to a chart from the Indicators list. It arrives as a gray dashed line at the last price with the price and an up/down arrow above it at the right end, next to the price scale; nothing needs setting. The step-by-step guide covers every message NinjaTrader can show and the update rule.

The price, then anything you switch on under Label Information: an up/down triangle, the move since this session’s open (O +3.25), the move vs the previous session’s close (C +8.50, the settlement on futures — the same figure NinjaTrader’s Net Change columns use), the distance to the session high and low (H 12.50 L 30.25), the session range (R 42.75), where price sits in that range (62%) and the session volume (V 412k, contracts on futures, shares on stocks). Moves and distances come in points, ticks or percent. The session is the one your chart’s Trading Hours template defines, so an RTH template gives RTH numbers. The triangle and the age are on by default; the statistics are off until you want them.

(stale): no trade for 30 seconds while the market is in session and the feed is connected; the line dims as well. (outside session): the session your chart’s Trading Hours template defines is closed. That is about your chart, not the market — an RTH chart at 03:30 reads (outside session) while ES is trading — and prints that arrive still win over the status. (no feed): the data connection is down. Separately from all three, the age readout (45s, 3m, 2h) appears once the price is more than ten seconds old and counts up, so a minute-old price and an hour-old price never look the same. These words are shown even with the price label switched off: the disclosure is not optional.

Static_Color keeps the line color (the default gray). Up_Down_By_Tick paints the up color after a rise and the down color after a fall. Flash_On_Tick flashes up or down on each price change, then returns to the line color. Above_Below_Session_Open paints up above this session’s open and down below it. Hit_Ask_Or_Bid paints up when the last trade hit the ask (buyers) and down when it hit the bid (sellers); it needs a feed that sends the quote with the trade. A mode that cannot answer says so in the label — (no open) on Renko, Heikin-Ashi, Line Break, Kagi and Point & Figure charts, whose bar open is constructed, or (no quote) — instead of quietly painting the neutral color. Set the label color to Transparent and the text follows the line’s color too.

Yes. Set Line follows to Another_Indicator, pick that indicator under Input series at the top of the dialog and set Panel to its panel (or tick Auto scale if the line gets a panel of its own). The line, the label and the arrow then track that indicator’s live value — cumulative delta and VWAP are the usual choices — and it is recomputed on every trade, so a study that moves on same-price trades is never left behind. In this mode the bid/ask lines and the price statistics are switched off, because they describe a traded price and an indicator has neither.

Because a number that would read backwards is worse than none. The distance to the high and low, the range and the range position hide while price sits outside the session’s own high and low (overnight on an RTH template, where the range is frozen and the tape keeps running). The move since the open hides outside session hours and on Renko, Heikin-Ashi, Line Break, Kagi and Point & Figure charts, whose open is constructed rather than traded. The open and the volume also need the loaded history to cover the session from its start, so load whole days.

Two reasons, both by design. On an instrument whose spread is one tick they sit right against the price line, so zoom the price scale in to see them. And when the chart is zoomed out so far that they would draw on top of the price line, Hide when zoomed out takes them away until you zoom back in; switch it off if you want them regardless. They also do nothing while the line follows another indicator.

No. It asks the chart for a repaint only when something on screen would actually change, and never more than 20 times a second; when the chart is slow to respond it backs off to about 5. In our benchmark its own work stayed under 0.05% of one CPU core with every statistic and the bid/ask lines on, at 1,000 ticks a second. If your chart ever lags with it on, email us: that’s a bug, not normal.

No. It reads your chart’s data feed and nothing else: no internet connection, no license check, no machine ID, no file written, and it never places, changes or cancels an order.

Yes. Each copy draws its own line and label. A common setup is one on the last price and a second on a lower panel following cumulative delta or VWAP.

Yes. Line color is the line’s color (the default gray), Line style is solid, dashed or dotted, Line width runs from 1 to 5 px and Line opacity fades it. Line color changes decides when it changes: Up_Down_By_Tick paints the Up color after a rise and the Down color after a fall (lime green and red by default); the other modes are in the answer on the five color modes above. Set Label color to Transparent and the label follows the line’s color too.

Yes. Show bid and ask draws a short bid line and a short ask line next to the price scale, from the quote itself, and Show bid/ask prices prints each price beside its line; each line has its own color, dash style, width and opacity. Hide when zoomed out takes them away when they would draw on top of the price line; the answer above on seeing them covers the one-tick spread. It is a bid and ask price display, not bid/ask volume or order flow.

Yes. Show move vs previous close adds C +8.50 to the label: the distance from the previous session’s close, which on futures is the settlement, the same figure NinjaTrader’s own Net Change columns use. Show move since session open adds O +3.25 for the move from this session’s open, and Moves and distances shown in sets points, ticks or percent. The session is the one your chart’s Trading Hours template defines.

Yes, exactly that: a horizontal line across the chart at the last traded price with the price as its label, moving with every trade, on any bar type, with the age of the price when the market goes quiet. It is not a drawing tool for prices you choose; for a line at your own level, NinjaTrader’s Horizontal Line drawing tool is the tool.

Email support, answered by the traders who built it. Bugs get fixed — this tool gets the same updates and support as our paid indicators.

The price you trade, always in view.

Free, no card, no license key. Download it, import it, and the line is on your chart in under a minute.

Not for you if you want a signal. CurrentPriceLine shows the price, its direction and the session around it; what to do with it is yours.

Pairs well with Free initial balance indicator (Live IB Range) · Weekly high/low lines indicator (Weekly H/L Lines) · Connection and system health HUD (SystemHUD)