NinjaTrader's built-in bar timer has a blind spot: it only works on time-based bars. Put it on a tick, range or volume chart — where most futures scalpers actually live — and it goes blank. This panel is the fix.
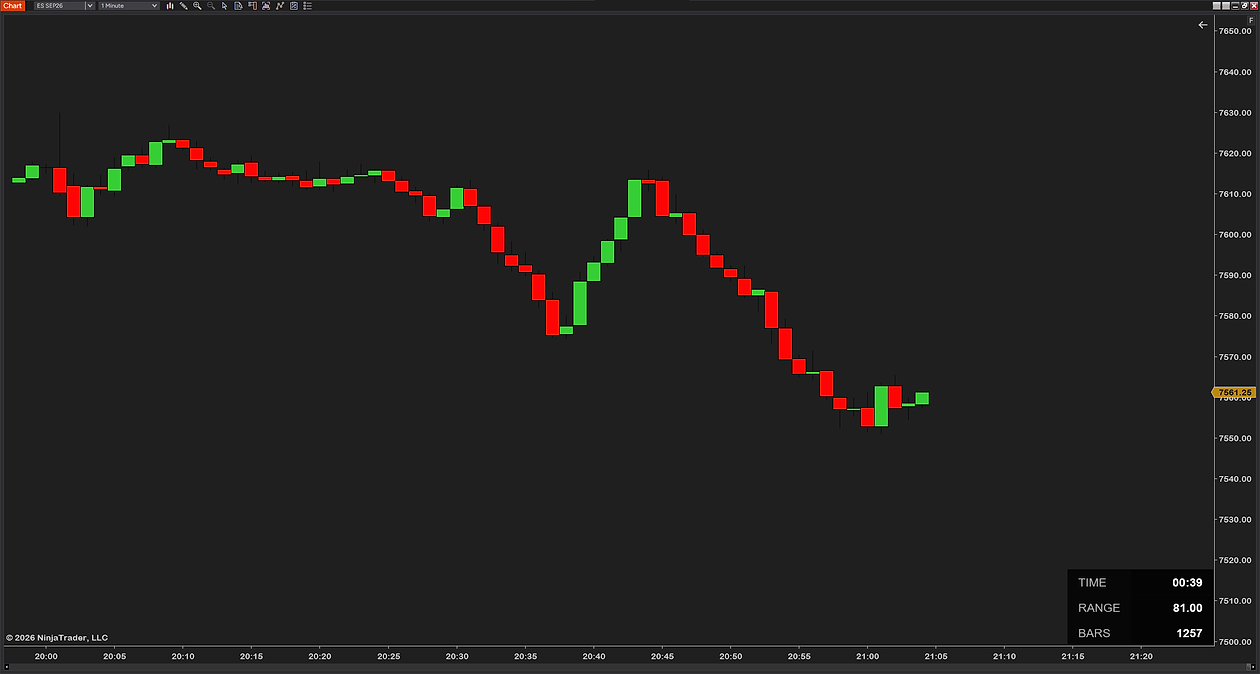
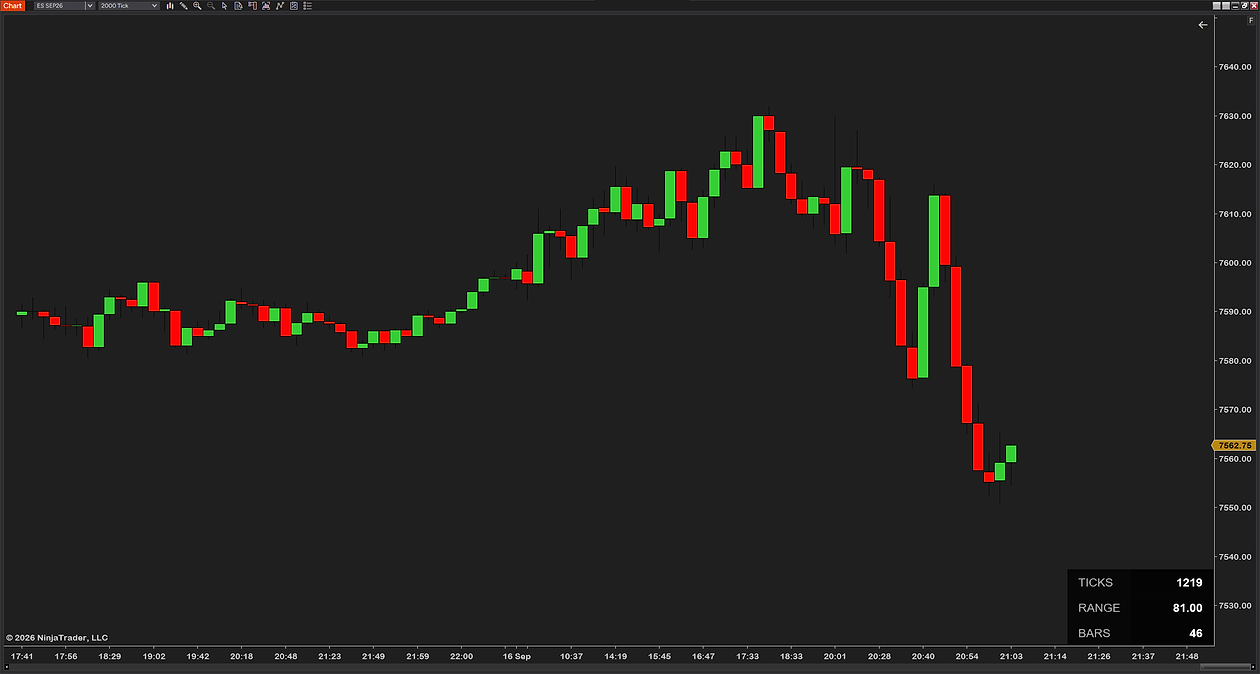
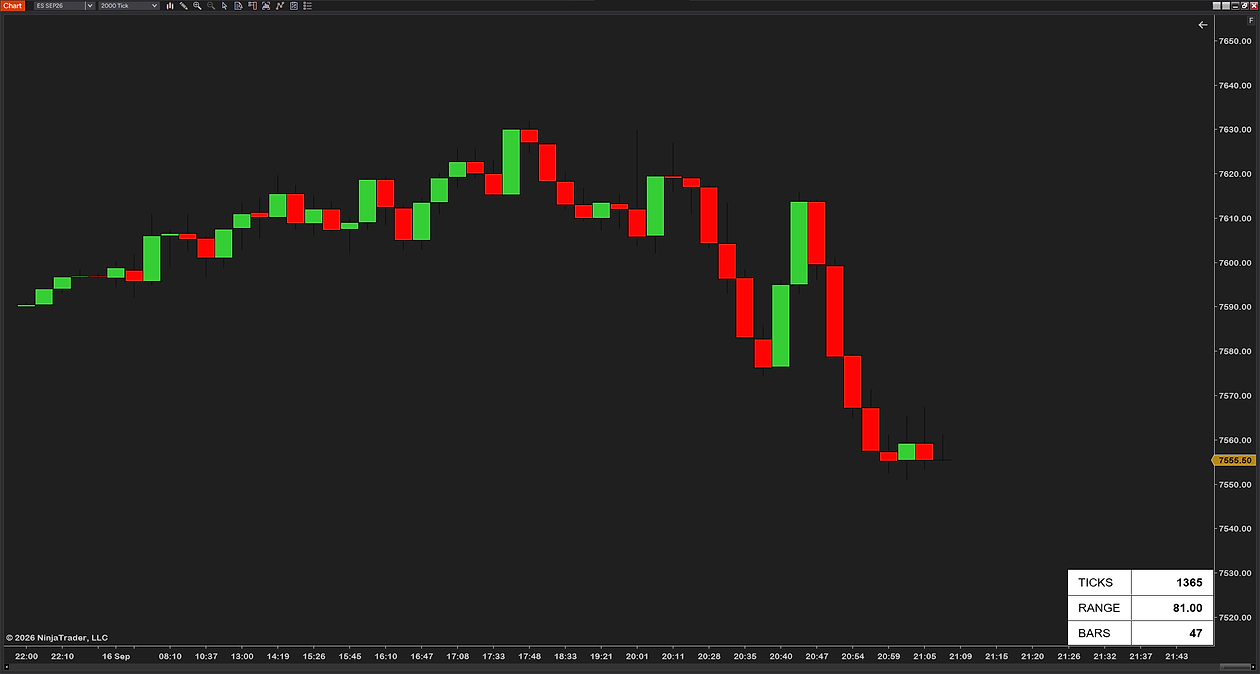
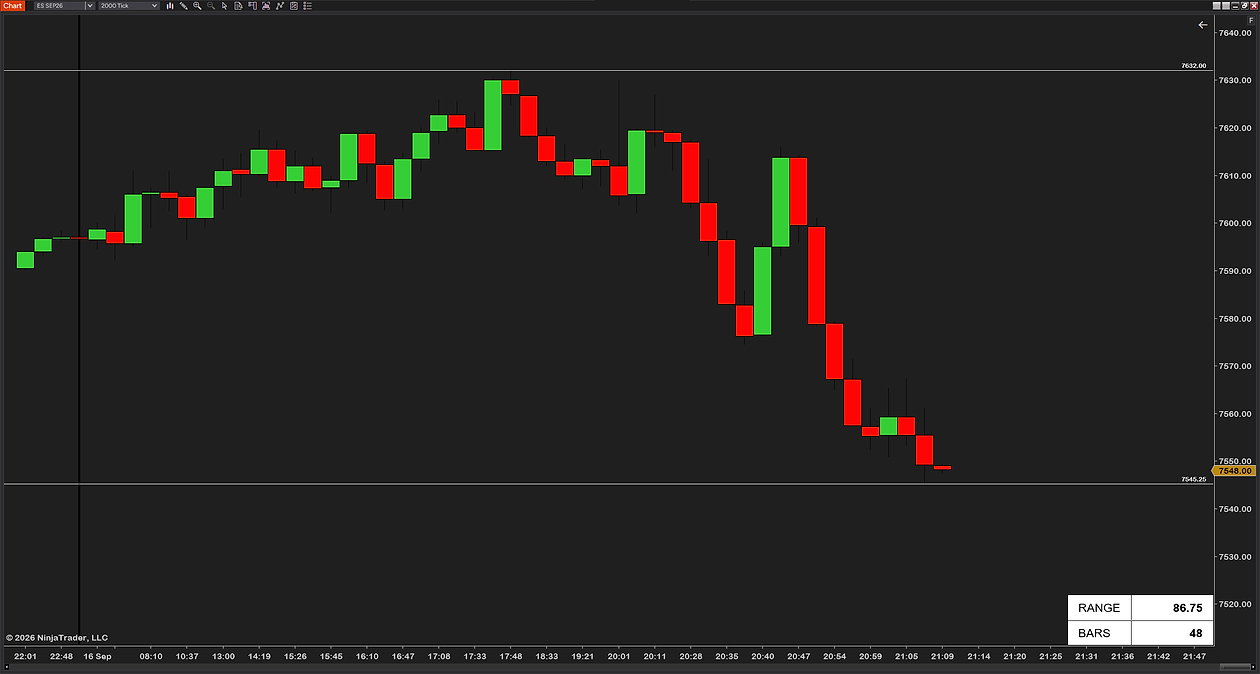
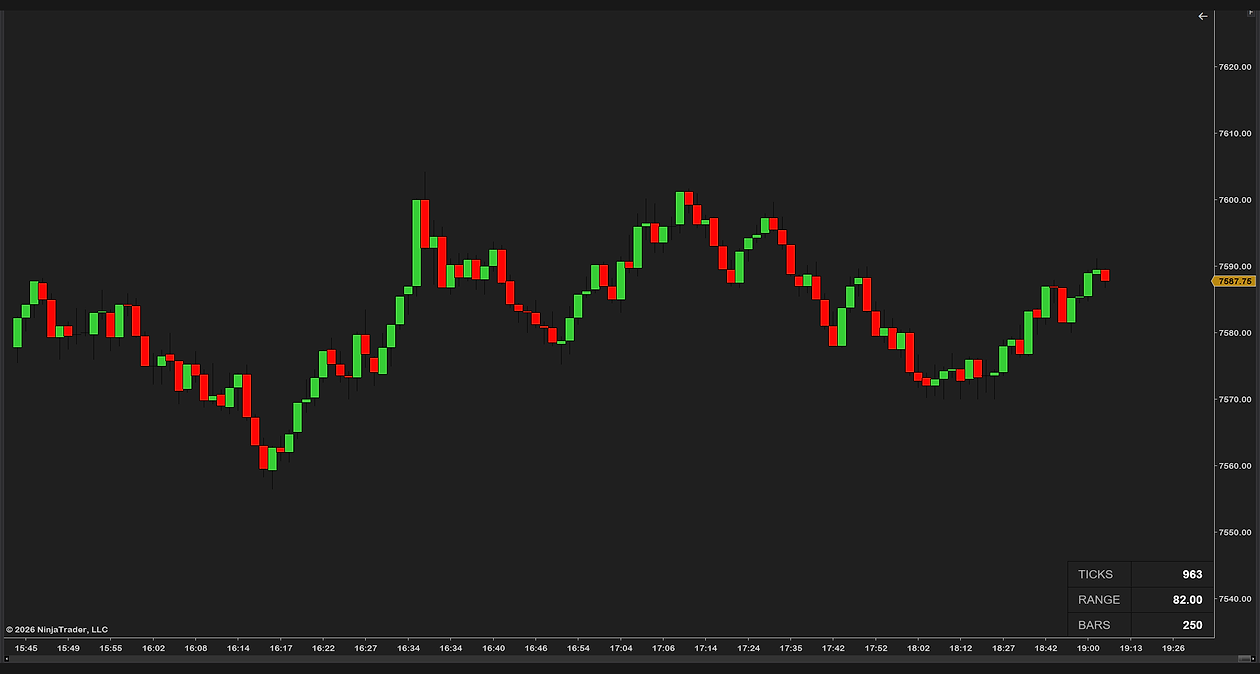
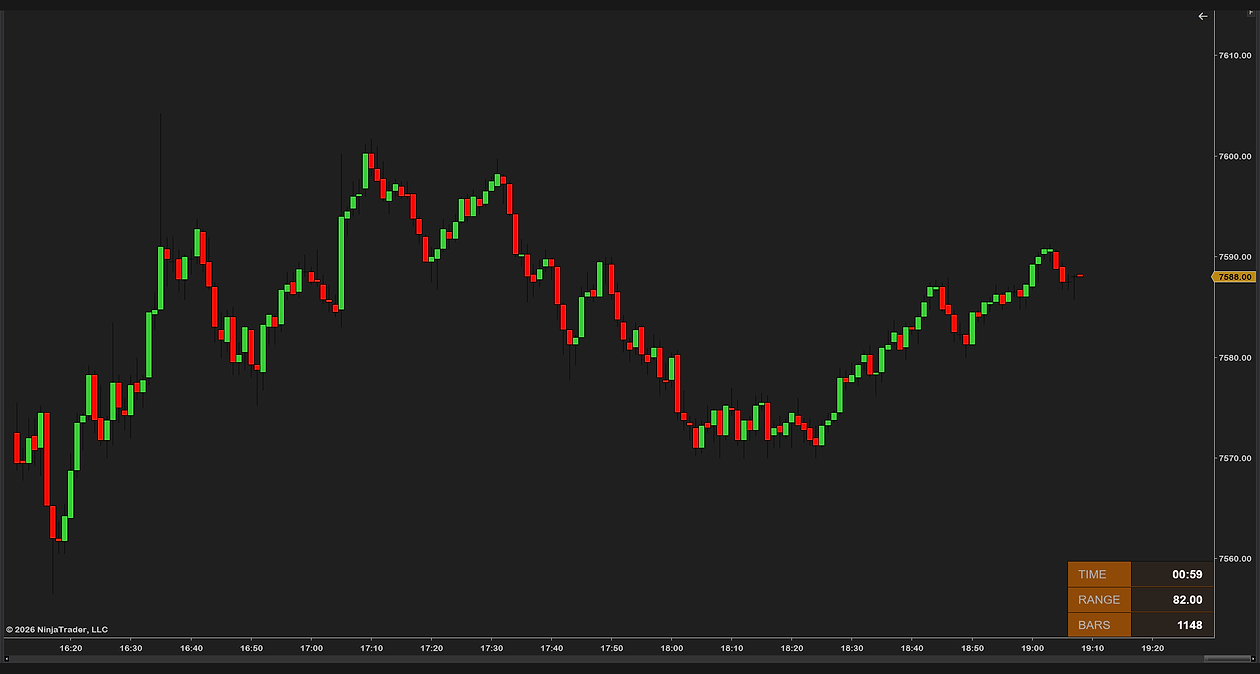
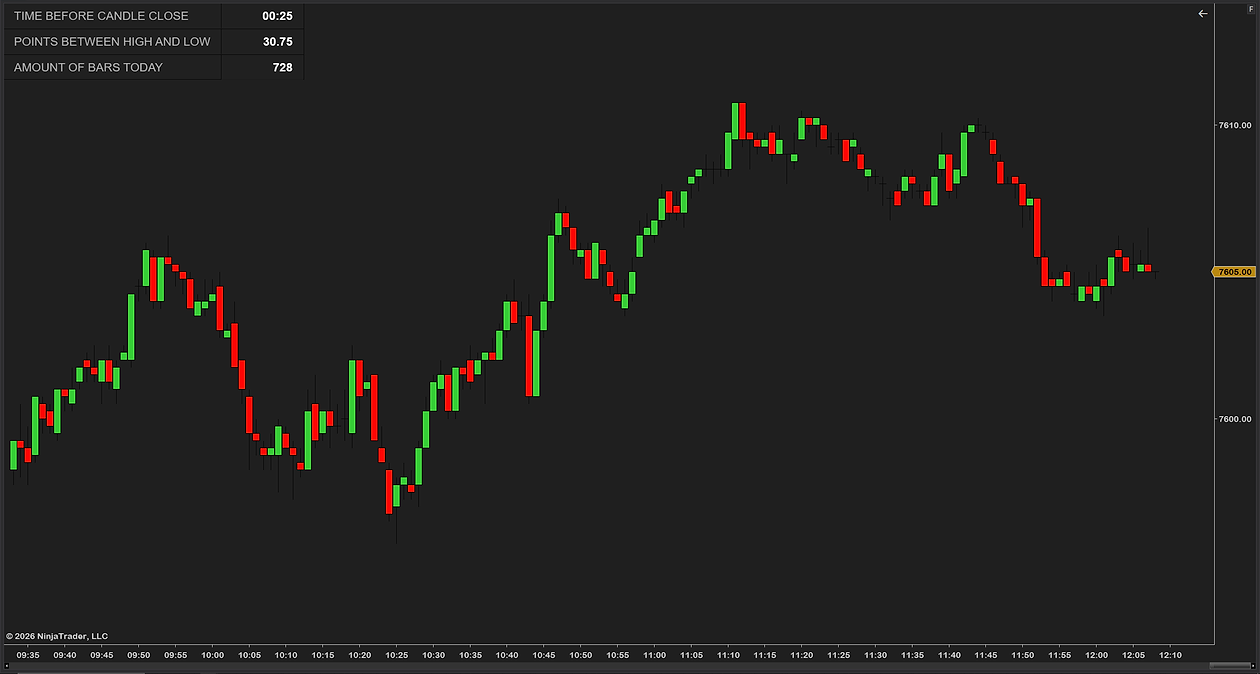
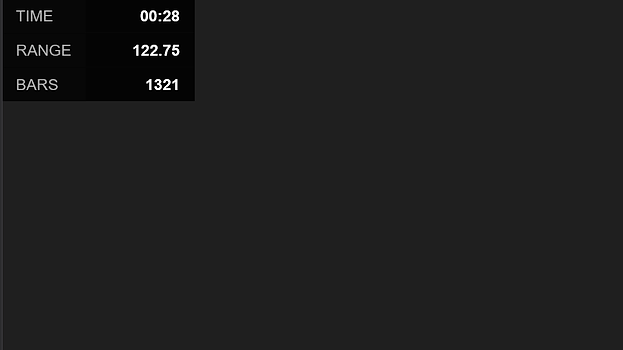
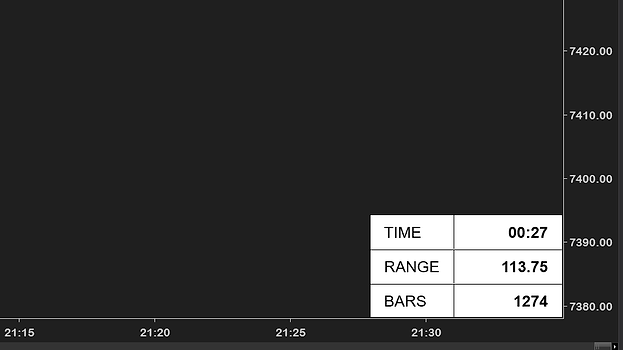
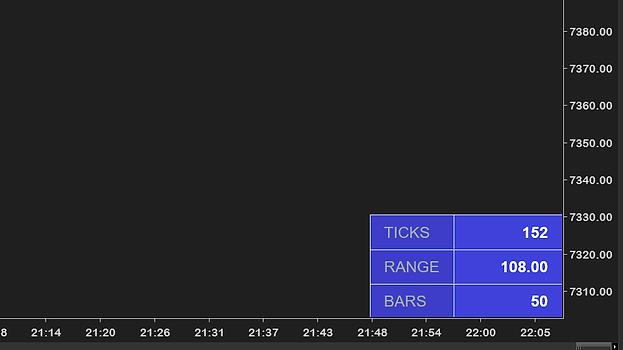
One clean readout, three rows: how much is left in the current bar — exact ticks remaining on a tick chart, a live countdown on a time chart — plus the session's range and how many bars have printed this session. It detects your chart type and adapts by itself.
The countdown row answers one question: am I early or late in this bar? On a 2000-tick chart it shows exactly how many ticks are left; on a minute chart it counts down to the second. You wait for the close instead of reading a half-formed candle as a signal.
The range row shows the session's full high-to-low move so far — instant context for whether today is a runner or a dud. The bars row counts bars printed this session: on tick and range charts, that's a direct read on how fast the tape is moving.
We scalp tick charts, and the native timer simply doesn't work there. Nothing existed that answers “where am I in this bar?” the same way on every chart type, in a panel you can actually style — so we built one, with the session range and bar pace in the same box instead of three separate tools.
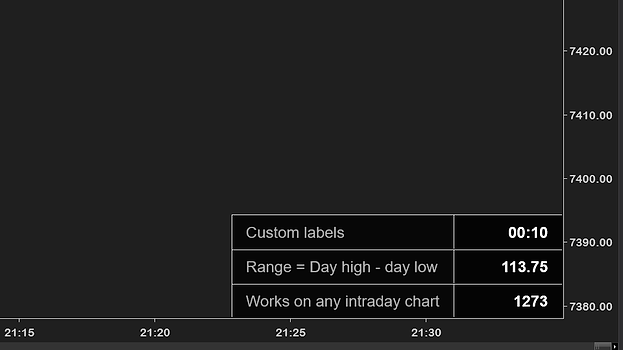
And honesty where it's due: no tool can count down a range or volume bar — their close depends on where price goes, not on the clock. On those charts the panel shows the live tick count building the current bar instead of pretending to know the future. Every row, label, color, font and position is yours to set. Free, lean, no bloat, no upsell — built by a working futures trader.
Your setup confirms on the close — so wait for the close. The countdown shows exactly how long, or how many ticks, until this bar is final. No more clicking one tick before the candle flips on you.
On a tick chart, ticks remaining IS the clock. A handful left in a fast market means the bar is about to print — get ready, or stand down and wait for the next one.
Bar count on a tick or range chart is a pure activity read. Far more bars than a normal session at the same hour means a fast tape — adjust your expectations and your size.
The session range row tells you how much the day has already traveled. If today's move is close to a typical full day, chasing a late breakout is a different bet than it was at the open.
None of these are trade signals — the panel tells you where you are in the bar, the session and the day. The entries, the stops and the discipline are still yours.
Want the bar timer explained? Read our full guide — How to see the bar timer & countdown →
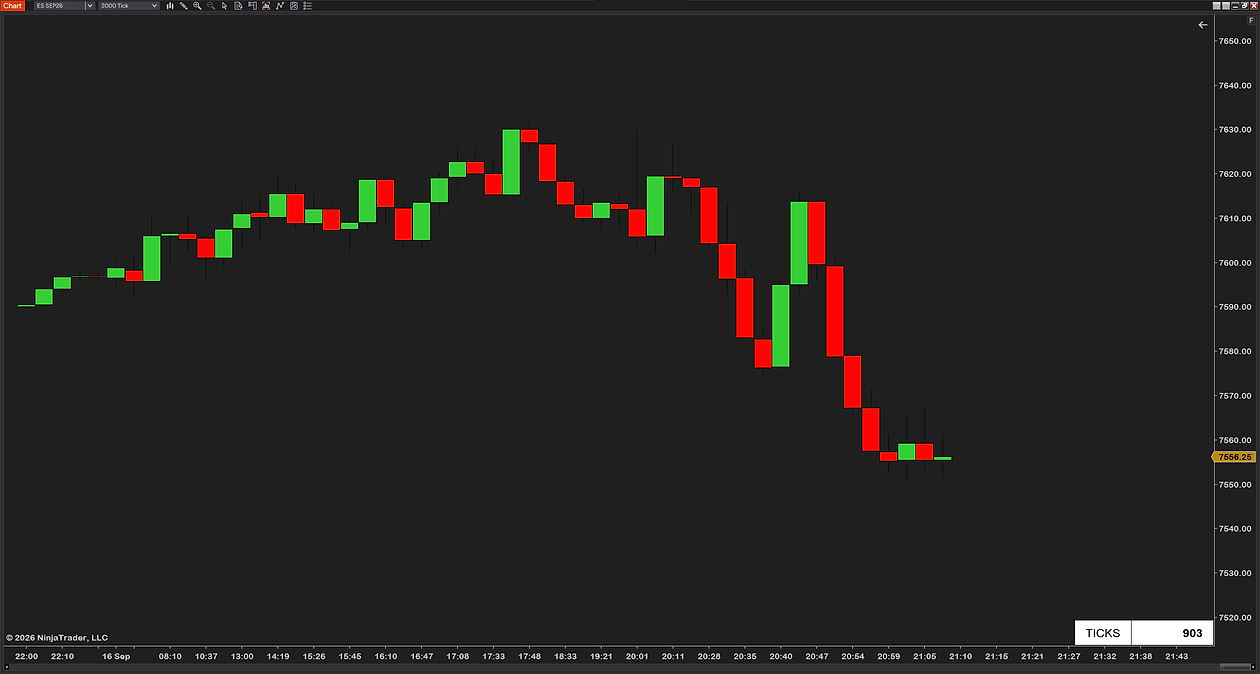
The panel is built to be set up once and left alone. Six numbered groups cover everything — rows, position, appearance, colors and your own row labels — nothing is hard-coded. Below is the actual settings panel: plain-English names, no cryptic abbreviations.
After checkout, download the Tick/Time + Range + Bar Counter .zip — it's on the confirmation page, and in your email receipt.
In NinjaTrader 8: Tools → Import → NinjaScript Add-On, then select the .zip.
Right-click any chart → Indicators, add TickTimeRangeBarCounter, and place the panel in the corner you like.
NinjaTrader 8 (latest version recommended)
Any instrument — no volume data required
Every chart type: tick, minute, volume, range and Renko
Any data provider — Rithmic, Kinetick, and more
Free forever — no catch, no upsell
Free updates — always current
Step-by-step installation guide
Email support from a working trader
Most traders are up and running in under a minute. Stuck on anything? Email us — we're traders too, and we answer.
A live bar-close countdown, session range and bar count in one clean panel — free, and built by a working futures trader.
Futures trading involves substantial risk of loss and is not suitable for every investor. This indicator is a charting and decision-support tool only — it is not a trade signal, recommendation, or financial advice. Past performance is not indicative of future results.