Daily H/L Lines

Free
Free NinjaTrader 8 indicator NinjaTrader 8 Indicator

Previous day high and low indicator: up to ten days of levels, each labeled at the price

No machine ID No license server No volume needed Instant download Free updates Verified on NinjaTrader 8.1.8.2 · 29 Sep 2026
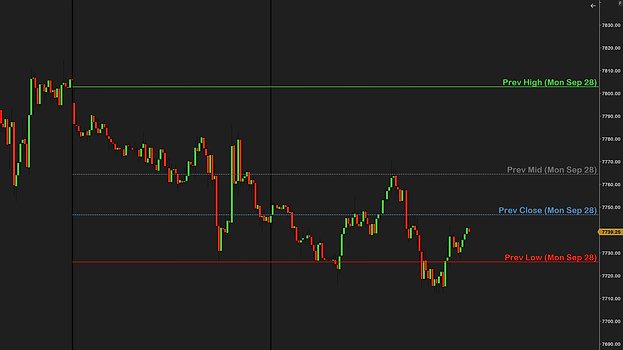
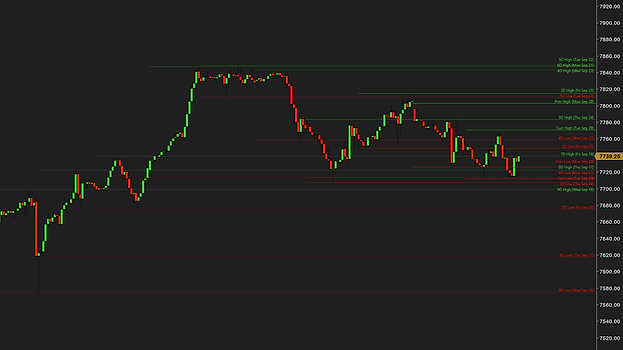
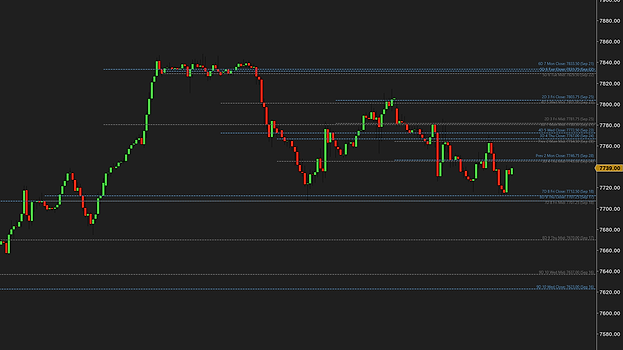
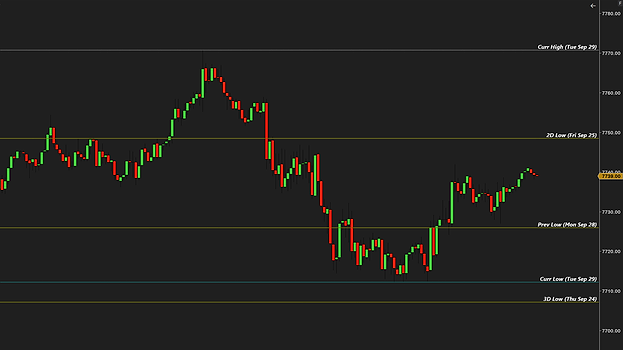
Daily H/L Lines on a 30-minute ES chart: today's high and low as dashed lines, the previous day's and the day before's as solid lines, highs green and lows red, each labeled at the right edge with its day and date, such as Prev High (Mon Sep 28) Four days of daily highs and lows on a 30-minute ES chart with number-only labels at the right edge: 1 for today, then 2, 3 and 4, highs green and lows red Ten days of daily highs and lows on a 60-minute ES chart, from today back to 9D, each with a small label at the right edge naming the day and its date Today alone on a 15-minute ES chart: its high, open, midpoint and low as lines, each labeled with day, number, weekday, level, price and date, such as Curr 1 Tue High: 7770.75 (Sep 29) The same day with larger labels and custom styles: a green high, an orange dotted open, a blue midpoint and a red low, labeled Curr 1 Tue High: 7770.75 (Sep 29), Curr 1 Tue Open: 7746.50 (Sep 29) and so on Labels at the start of each day on a 15-minute ES chart: 2D High (Fri Sep 25), Prev High (Mon Sep 28) and Curr High (Tue Sep 29) each sit above its line where the day begins, and the lows the same Midpoints and closes on a 15-minute ES chart with the highs switched off: 2D Close, 2D Mid and 2D Low (Fri Sep 25), Prev Mid, Prev Close and Prev Low (Mon Sep 28), closes in blue and midpoints in gray, labeled where each day begins Every level switched on for ten days on a 30-minute ES chart: highs, lows, midpoints and closes plus today's open, each label reading day, number, weekday, level, price and date, such as 9D 10 Wed Low: 7575.00 (Sep 16) Ten days of highs only on a 60-minute ES chart, the past days in orange and today's high in green, with number-only labels 1 to 10 Ten days of highs in orange and lows in white on a 60-minute ES chart with number labels, and the info box in the bottom-right corner listing each day's date, high, low and range in percent, today starred
1 / 10

Daily high, low and mid lines + up to 10 days, fully automatic.

Works on
Chart types
Tickany count
Minuteany, daily too
Volumeany size
Range, Renkoand Heikin-Ashi
Instruments
Futuresthe full session
Stocksany exchange
FX and cryptono volume needed
Data providerany
Needs
NinjaTrader 8any recent version, free tier included
Dataprice only, no volume
Licensenone, nothing to activate
Machine IDnone

In short: NinjaTrader 8 and a chart. That is all Daily H/L Lines needs.

Load at least as many days of chart data as days you show. Weekly and larger bars are not supported.

Get Daily H/L Lines on your chart

You might ask: why is this free, what is the catch? There is none. We want to change the market for third-party NinjaTrader tools, and giving our work away is part of how we do it.

To say it plainly: this market is overpriced and full of low-quality tools with missing features and bugs. Vendors charge hundreds of dollars for simple indicators. No indicator, add-on or tool will make you profitable. A good one makes your trading environment better, and you know that already, or you would not be here looking.

Our goal is the highest-quality products we can build, tools that make a real difference on the chart. We get there by testing hard: weeks on live charts before release, feedback from the traders who use them, and a close read of what the forums complain about. We offer a full refund within 14 days, we adapt tools for customers who ask, and we give most of our work away.

Most of our tools are free for a reason. We want you to try them, see the quality and the features for yourself, and not spend a dollar with us until you think a tool deserves it. We are a business and we intend to make money, by solving real problems for traders.

So yes, Daily H/L Lines is completely free, no strings attached. If you like it, there are more free tools and paid ones priced well under what is usual in this market. Leave a review if you want to, good or bad, we read every one. If you have any questions, please email us at [email protected].

Free download

$0/forever

No card, no license key, no expiry. Nothing to cancel because nothing was started.

Download free
Included:
  • Up to ten days of levels, every line, label, fade and info-box setting
  • Free updates
  • Support by email — answered within a day
  • Same install as the paid tools — one zip, one import
  • No license server, no machine ID

Delivered by Creem. The download link lands on the next page and in your email.

Ten days of levels, setting by setting.

Thirty-two settings in seven groups, and the six things they add up to. The names in bold are the names in the indicator’s settings window.

Previous day high and low, up to ten days

Days to show draws today and the trading days before it, from 1 to 10, four by default. Set it to 2 and untick Show current day once the session has opened, and only the previous day’s high and low remain, the PDH and PDL. Show high lines and Show low lines switch each level on or off. Load at least as many days of chart data as days you show, and each line starts where its own day starts.

Full-session futures levels, on every chart

The levels come from NinjaTrader’s daily bars in the instrument’s default trading hours: for CME futures, the full session, overnight included; for US stocks, the regular session. On a futures RTH chart a level can sit outside the bars you see, and the high, low and open are the same whether the chart has been running or was just reloaded. Renko, range and Heikin-Ashi charts use the same daily bars.

Today’s high and low of day, live

Show current day keeps today on the chart: its high of day and low of day move the moment price makes a new extreme. The Current Day Lines group styles it apart from the past days with its own High line, Low line and Mid line, dashed by default. Show open line adds today’s opening price, the full-session open, as a gold dotted line with its own Open line style.

Midpoints, closes, older days faded, line length

Show mid lines adds the halfway price between each day’s high and low, and Show close lines each day’s close, the previous day’s close included; both are off by default. Fade older days dims older days in steps, to about a quarter of full strength. Lines start/end runs a level to the right edge, across the chart, to the current bar, solid then dotted, or not at all, leaving the labels.

Labels you build from checkboxes

Show day (Curr, Prev, 2D), Show level name (High, Low) and Show date are on by default, as in Prev High (Mon Sep 28). Add Show day number (1, 2, 3), with today as 1, Show weekday (Mon, Tue) or Show price, or untick the rest for number-only labels. Horizontal position puts them at the right edge or at each day’s start, Vertical position above, on or below the line.

Label colors and a daily info box

Same color as lines gives each label its line’s color; untick it and Label color sets one color for all. Background color and Background opacity (%) add a box behind each label, none at 0, the default. Font sets the text. Show info box lists each day’s high, low, range as a percent of the low and date, today starred, in the corner Info box position picks.

How traders use it

Four ways to trade around the levels the whole market already has marked. None of them is a signal; the entries, the stops and the discipline are still yours.

At the levelThe previous-day fade

Price runs into yesterday’s high and stalls, at a level every day trader has marked. A rejection there is one of the most common fades in futures.

Through the levelThe break and go

Price closes beyond yesterday’s high or low and holds: the market accepting prices outside yesterday’s range. Trade the retest, or trail the move with the level behind you.

Older daysThe level from last week

A high or low from three or five days ago still matters when price comes back to it. With several days shown, the old levels are on the chart before price gets there.

BiasThe open and the midpoint

Above today’s open, the day’s buyers are ahead; below it, the sellers. Yesterday’s midpoint splits yesterday’s range in two. Two lines that keep your trades on the right side of the day.

New to trading key levels? Read the full guide →

Frequent questions.

Question or idea for improvement? Email us. We reply fast.

Download the zip, then in NinjaTrader 8 go to Tools → Import → NinjaScript Add-On and pick the file. Add DailyHLLines (that is how it is spelled in NinjaTrader’s list) to any chart from the Indicators list and the daily levels are drawn — most traders are done in under a minute. The step-by-step guide covers every message NinjaTrader can show and the update rule.

Genuinely free — no trial period, no locked settings, no license key, nothing to upgrade to. We sell other indicators; free tools like this one are how we show you the quality of the work first.

From one to ten days, counting today — four by default, which is today and the three trading days before it. Untick Show current day to hide today. Load at least as many days of chart data as days you show; if an older day’s line starts at the chart’s left edge, raise Days to load in the chart’s Data Series settings.

For every day, the daily high and low, and if you switch them on, the midpoint and the close. For today it can also draw the opening price. Each level has one checkbox. The high, low and midpoint each have one style for today and another for past days; the close has one style for every day, and today’s open its own. By default a line starts where its day starts and runs to the right edge. A line can also span the whole chart, stop at the current bar, turn dotted after its day ends, or be switched off to show labels only.

They follow the instrument’s default trading hours, on every chart. The levels come from NinjaTrader’s daily bars in those hours: for CME futures the full session, overnight included, so on an RTH chart a level can sit outside the bars you see; for US stocks the regular session, so a stock chart with extended hours still shows regular-session levels. The high, low and open are the same whether the chart has been running all day or was just reloaded. On an RTH futures chart, a holiday on which CME still traded a short session shows as its own short day, the same as on a full-session chart.

Close lines are off by default; switch on Show close lines. Each finished day gets its close from NinjaTrader’s daily bar — the last trade or the settlement, depending on your data provider. On a chart left running, today’s close appears at the next session’s open, as the previous day’s close; on a chart loaded after the close it is there at once. On a chart set to trading hours other than the instrument’s default, only past days get a close line.

You build the label from checkboxes: Show day (Curr, Prev, 2D), Show level name (High, Low) and Show date are on by default, the level name reading High, Low, Mid, Open or Close; add Show day number (1, 2, 3), with today as 1, Show weekday (Mon, Tue) or Show price. Labels sit at the right edge or at the start of each day’s line, above, on or below it, in their line’s color or one color of your choice, with an optional box behind them. Right-edge labels are spaced so they never overlap; if the panel has no room for all of them, the lowest are left out.

No. The daily levels never pull the price scale, so a high from ten days ago does not compress today’s bars. Scroll the price axis to see a level that is off screen.

No. It only redraws when something changed — a new day, a new high, low, open or close, or a setting — so most price changes cost almost nothing. If your chart ever lags with it on, email us: that’s a bug, not normal.

Yes. At its defaults it draws the previous day’s high and low — the PDH and PDL — and the two days before them, plus today as it trades. For the previous day alone, once today’s session has opened, set Days to show to 2 and untick Show current day. Each level gets a label beside its line, such as Prev High (Mon Sep 28), and the lines never pull the price scale, so a level far from today’s price does not squash today’s bars.

For one day, yes: NinjaTrader 8’s Prior Day OHLC plots the previous day’s open, high, low and close, and Current Day OHL today’s open, high and low. Prior Day OHLC builds its day from the chart’s own bars, so on an RTH chart it gives the RTH day, and its lines carry no names or dates. Daily H/L Lines draws up to ten days at once, each with a label, full-session on futures, RTH charts included, with midpoints, older days faded and an info box. For the previous day’s levels together with the session and weekly opens, see Intraday Reference Levels; our key levels guide lists everything that ships.

Yes. Run it next to its free twins, Weekly H/L Lines and the monthly high and low indicator. The dates tell them apart, Prev High (Mon Sep 28) for a day, (Sep 20) for a week, (Aug 2026) for a month, but all three ship in green and red, so give each its own colors. Where two levels sit at the same price, set one indicator’s Horizontal position to Left so the labels sit apart.

As reference levels. Yesterday’s high and low are where yesterday’s buyers and sellers ran out, and day traders have them marked, so price often reacts there: a stall at the level is a possible fade, a close beyond it that holds is the market accepting a new range. The indicator marks the levels and gives no signals; the entries, stops and discipline stay yours. Our previous day high and low guide goes deeper.

Email support, answered by the traders who built it. Bugs get fixed — this tool gets the same updates and support as our paid indicators.

Yesterday’s levels, on every chart.

Free, no card, no license key. Download it, import it, and the daily levels are on your chart in under a minute.

Not for you if you want the tool to tell you when to buy and sell. Daily H/L Lines marks the levels the market watches; the trade is yours.

Pairs well with Free weekly high and low indicator (Weekly H/L Lines) · Free monthly high and low indicator (Monthly H/L Lines) · Key levels indicator (Intraday Reference Levels) · Current price line indicator (CurrentPriceLine)