Live Range Levels

Free
Free NinjaTrader 8 indicator NinjaTrader 8 Indicator

Today’s high, low and midpoint, live: overnight, premarket or RTH, plus any % level you type

No machine ID No license server No volume needed Instant download Free updates Verified on NinjaTrader 8.1.8.2 · 4 Oct 2026
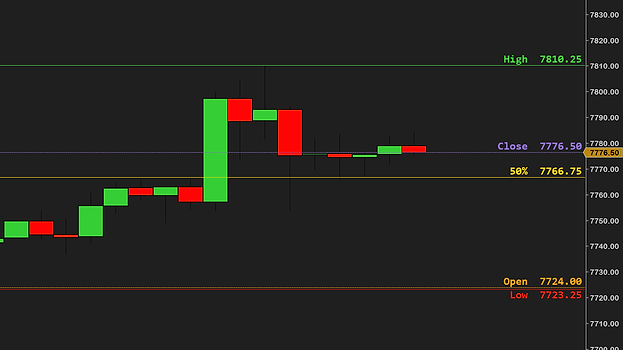
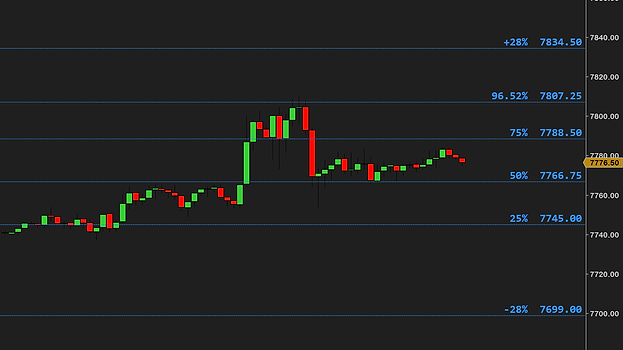
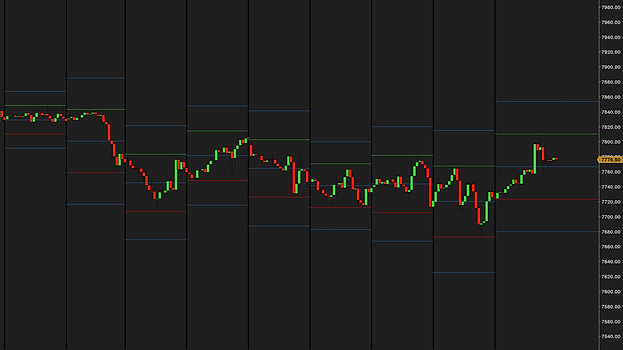
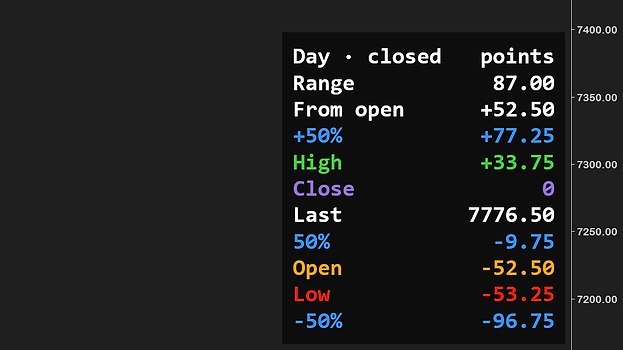
Live Range Levels on a 15-minute ES chart with its default settings: today's high in green, low in red and the 50% midpoint, plus the +50% and -50% extensions in blue, each labeled with its name and price at the price scale; the previous day's high, low and 50% stay inside that day, labeled PD High, PD 50% and PD Low Yesterday's levels alone on today's chart: PD High, PD 50% and PD Low with the PD +50% and PD -50% extensions run from the previous day's open across today's price to the price scale on a 15-minute ES chart, today's own lines switched off Five days of ranges on a 15-minute ES chart, each day with its high in green, its low in red, the 50% in gold and a level every 25% out to +100% and -100% of the range in blue, labeled 4D, 3D, 2D, PD and, for today, the level alone, every label with its price Labels at the start of each day's lines on a 15-minute ES chart: the high, low, 50% and the levels every 25% beyond the range for 2D, PD and today, white text on dark boxes above each line where the session begins The previous day's range in eighths across today on a 15-minute ES chart: PD High in green, PD Low in red, PD Open in orange, PD Close in purple, the PD 50% in gold and a line every 12.5% between the high and the low, with small labels at the price scale The previous day's range and its extensions on a 15-minute ES chart: a line every 12.5% from PD 0% at the low to PD 100% at the high, then +25%, +50%, +75%, +100%, +125% and +150% of the range above the high in blue, all running across today Fibonacci levels of the day's range on a 15-minute ES chart: 0%, 23.6%, 38.2%, 50%, 61.8%, 78.6% and 100% for today, labeled with their prices at the price scale, and the same seven for the previous day inside its own session, labeled PD 0% to PD 100% High, low, open, close and midpoint for two days on a 15-minute ES chart: High, Close, 50%, Open and Low for today, PD High, PD Close, PD 50%, PD Open and PD Low for the previous day, each in its own color with its price, and the info box in the bottom-right corner listing the range and the distance from the last price to every line A custom session on a 15-minute ES chart: the 25%, 50% and 75% of the range between a start time and an end time you type, drawn only inside that session on two days and labeled Custom PD 75% and Custom 2D 75% where each line starts, with the info box in the bottom-right corner Typed levels for a custom session on a 15-minute ES chart: 24%, 65.5% and 92% of the range and the extensions +6.889%, +25% and +50%, each extension mirrored below the low, with large white labels such as Custom PD 65.5% 7785.00 where each line starts and the info box listing the distance to every line
1 / 10

Project yesterday’s levels onto today’s price action.

The previous day’s high and low projected onto today on a 15-minute ES chart: PD High in green, PD Low in red, the PD 25%, PD 50% and PD 75% levels and the PD +50% and PD -50% extensions in blue, each labeled with its price at the price scale

Choose exactly the % levels you want to see.

Today’s high and low on a 5-minute ES chart with a level every 10% of the day’s range, from 10% to 90%, in blue between the green high and the red low, each labeled with its price at the price scale

What it adds to a basic high/low indicator.

The levels Basic H/L Live Range Levels
Today’s high and low, live the lines move the moment a new extreme prints✓✓
The midpoint, live the 50% of the day, moving with every new high or low✓
Any % level you type 61.8, 73.2, +50, -25: ten boxes, decimals allowed✓
Level sets in one setting quarters, thirds, eighths or Fibonacci✓
Any session
The chart’s own trading day the full session on a futures chart✓✓
True RTH levels on an overnight chart from NinjaTrader’s own RTH template, where the instrument has one✓
Overnight, Asia and London the index futures premarket, on New York time✓
Your own start and end time any window, across midnight too✓
More than today
Yesterday’s range across today fixed levels, labeled PD or Prev✓
Up to ten days of ranges each on its own session, or run on to the right✓
Extensions beyond the range, mirrored +50% above the high also draws -50% below the low✓
Yours to set
Every preset line and custom level styled on its own color, dash and width✓✓
Text labels on every line and an info box name, price, day; distance to every level in points, ticks or %✓
Free, with free updates no trial, no locked settings, no upsell✓✓
Works on
Chart types
Tickany count
Minute, secondany intraday size
Volumeany size
Rangeany size
Instruments
Futuresall exchanges
Stocksand ETFs
FX and cryptono volume needed
Data providerany
Needs
NinjaTrader 8any recent version, free included
Dataprice only, no volume
Licensenone, nothing to activate
Machine IDnone

In short: NinjaTrader 8 and an intraday chart. That is all Live Range Levels needs.

Intraday charts only: nothing is drawn on Daily or larger bars, or on Heikin-Ashi, Renko, Kagi, Line Break and Point-and-Figure bars, whose prices are calculated. Load one day more than you want to see.

Get Live Range Levels on your chart

You might ask: why is this free, what is the catch? There is none. We want to change the market for third-party NinjaTrader tools, and giving our work away is part of how we do it.

To say it plainly: this market is overpriced and full of low-quality tools with missing features and bugs. Vendors charge hundreds of dollars for simple indicators. No indicator, add-on or tool will make you profitable. A good one makes your trading environment better, and you know that already, or you would not be here looking.

Our goal is the highest-quality products we can build, tools that make a real difference on the chart. We get there by testing hard: weeks on live charts before release, feedback from the traders who use them, and a close read of what the forums complain about. We offer a full refund within 14 days, we adapt tools for customers who ask, and we give most of our work away.

Most of our tools are free for a reason. We want you to try them, see the quality and the features for yourself, and not spend a dollar with us until you think a tool deserves it. We are a business and we intend to make money, by solving real problems for traders.

So yes, Live Range Levels is completely free, no strings attached. If you like it, there are more free tools and paid ones priced well under what is usual in this market. Leave a review if you want to, good or bad, we read every one. If you have any questions, please email us at [email protected].

Free download

$0/forever

No card, no license key, no expiry. Nothing to cancel because nothing was started.

Download free
Included:
  • Every level, session, label and info-box setting
  • Free updates
  • Support by email — answered within a day
  • Same install as the paid tools — one zip, one import
  • No license server, no machine ID

Delivered by Creem. The download link lands on the next page and in your email.

How traders use it

Four ways to trade around today’s range. None of them is a signal; the entries, the stops and the discipline are still yours.

The 50%The halfback

The midpoint of the day is where a trending day pulls back to and where a rotating day keeps returning. With it drawn live, you always know which half of the range price is trading in.

BiasUpper half, lower half

Above the midpoint the day’s buyers are ahead, below it the sellers. The quarters split it further: holding above 75% is strength, sitting under 25% is weakness, the middle is where days go quiet.

Beyond the rangeExtensions as targets

When price leaves the range, the range itself is the ruler. Half a range and a full range beyond the high or low are places many traders take profit, and with Mirror on both sides are drawn at once.

Other sessionsThe overnight range

Draw the overnight high and low, or the Asia or London range, with its midpoint, then watch what the regular session does with it: a break, a move back inside, or a test of the 50%.

New to trading key levels? Read the full guide →

Frequent questions.

Question or idea for improvement? Email us, we reply fast.

Download the zip, then in NinjaTrader 8 go to Tools → Import → NinjaScript Add-On and pick the file. Add LiveRangeLevels (that is how it is spelled in NinjaTrader’s list) to any intraday chart from the Indicators list and today’s levels are drawn — most traders are done in under a minute. The step-by-step guide covers every message NinjaTrader can show and the update rule.

Genuinely free — no trial period, no locked settings, no license key, nothing to upgrade to. We sell other indicators; free tools like this one are how we show you the quality of the work first.

Today’s high and low, the midpoint of the range (the 50%), and one extension on each side: +50%, half a range above the high, and -50%, half a range below the low. On a full-session futures chart the day starts the evening before; set Session to RTH for the regular session’s high of the day and low of the day. Today’s lines carry a label with name and price at the price scale. Previous days to show is 1, so yesterday’s session shows the same lines for yesterday’s range, labeled PD where that session ends. Everything else — the open, the close, quarters, Fibonacci levels, your own levels, the info box — is one setting away.

As a percent of the range, where 0 is the low and 100 is the high: 50 is the midpoint, 61.8 or 73.2 sit inside the range. Beyond the range, type +50 (or 150) for half a range above the high and -50 for half a range below the low, up to 1000% either way. There are ten boxes, Custom level 1 (%) to Custom level 10 (%), decimals allowed, each with its own line style. The chart labels read the same way, so you can always type what a label shows.

Yes, by default, and it moves live: every time the day makes a new high or low the 50% line is redrawn at the new midpoint. Traders also call it the halfback or the midline. Out of the box the midpoint comes from Custom level 1 (%), which ships as 50; Day mid (50%) in the preset levels draws the same line if you would rather free that box for another level.

It draws the line between them. Traders who follow ICT call the 50% of a range equilibrium, with premium above it and discount below. Live Range Levels draws that 50% for today’s range or a session’s, live, or for yesterday’s finished range, and the quarters or any % level you type on either side of it. It does not shade the zones, and it does not pick a swing high and low for you: the range is always a day or a session.

Today’s levels do, and that is the point: they are measured from today’s range, so when price makes a new high or low the high or low line follows it and every % level between and beyond them moves with it. Finished days do not change. With Previous day’s levels (PD) on, the lines come from yesterday’s finished range and stay fixed all day.

Your choice, under Session. Full_Day, the default, uses the chart’s own trading hours — on a standard CME futures chart the full session from 18:00 New York. RTH uses NinjaTrader’s own regular-hours template for the instrument, so a full-session chart gets true RTH levels with nothing to set up; where NinjaTrader has no such template for an instrument, RTH gives the chart’s own hours and the labels do not say RTH. Overnight (18:00 to 09:30 New York), Asia (18:00 to 03:00) and London (03:00 to 09:30) follow New York time on any chart clock, through every clock change.

Yes. Set Session to Overnight and it draws the overnight high and low, with the midpoint and any % level you type, for 18:00 to 09:30 New York — on ES and NQ the Globex hours before the cash open — through every clock change. The lines move live while the overnight session runs, labeled ON High and ON Low. When the session ends they stop moving and, with Extend today’s lines to the right on and Previous days to show at 1 or more, as it ships, run on across the regular session to the price scale, labeled ON Prev High and ON Prev Low. The chart must load the overnight hours (a regular-hours chart has none) and, on tick, volume and range bars, at least two days: a session whose start is not on the chart is dropped when it ends.

Yes. On index futures such as ES and NQ the premarket is the overnight session: Session set to Overnight gives the high and low made before the 09:30 New York open, live, then carried across the regular session. For stocks, ETFs and markets that open at another time, check Use custom session and type the pre-market hours as Start time and End time, as your chart’s time axis shows them, on a chart whose trading hours include them: NinjaTrader’s own US Equities ETH template starts at 08:00 New York, so earlier hours need a trading hours template of your own. Check Extend today’s lines to the right again to carry the levels into the regular session. Either way the premarket midpoint and your % levels come with it.

Yes. Check Use custom session and type a Start time and an End time as your chart’s time axis shows them: 08:00 and 18:00, or 8:00 AM and 6:00 PM. An end earlier than the start runs past midnight. The lines then stay between those two times; check Extend today’s lines to the right again to carry them on to the price scale. A time that cannot be read leaves the Session setting in use.

Yes, two ways. Previous day’s levels (PD) draws yesterday’s finished range across today’s price, every level labeled PD (Prev for Overnight, Asia and London while Extend today’s lines to the right is on). Once today’s session has ended, with that switch on, today’s own range becomes the new PD, drawn from its last bar on, and the lines across the finished day read 2D (Prev2 for those sessions). Or keep today’s live levels and add yesterday’s: Previous days to show 1 with Extend previous days’ lines to the right runs yesterday’s lines on across today; switch Show current day off to see them there without today’s own. Up to ten days can be shown. For the previous day’s high and low with dates, fading and up to ten days at once, see our free previous day high and low indicator.

Intraday charts: minute, second, tick, volume and range bars, on any instrument and any data provider, with no volume data needed. Nothing is drawn on Daily or larger bars, or on Heikin-Ashi, Renko, Kagi, Line Break and Point-and-Figure bars, whose prices are calculated rather than traded. A session other than the full day is exact on bars that divide evenly into its start and end, such as 1, 5, 15 or 30 minutes for RTH on ES; on larger or non-time bars the bar that crosses the start is counted whole and the bar that crosses the end is left out.

For the day’s open, high and low, yes: NinjaTrader 8’s Current Day OHL plots those three, and Prior Day OHLC plots yesterday’s open, high, low and close. Neither has a midpoint or percentage levels, and both follow the chart’s own trading hours only, so neither keeps an overnight or premarket high and low apart from the day’s on a full-session chart. NinjaTrader’s Fibonacci retracement tool draws percentage levels, but you anchor it by hand and it stays where you put it. Live Range Levels measures the range for you, redraws every level when the range grows, and does it for the session you choose.

No. Live Range Levels draws on the chart only: it has no alerts and offers no values to the Strategy Builder, the Market Analyzer or NinjaTrader’s Alerts window. We left those out on purpose — what it shows, it shows correctly, and we would rather not offer a half-reliable signal.

No. The lines never pull the price scale, so a +100% extension does not compress today’s bars. A level outside the prices on screen shows once you scroll or compress the price scale.

A day whose first bars are not on the chart is drawn only while its session is still trading. Once the session has ended its range could be too small, because part of the day is missing, so it is left out. Load one day more than you want to see: raise Days to load in the chart’s Data Series settings.

Email support, answered by the traders who built it. Bugs get fixed — this tool gets the same updates and support as our paid indicators.

Sixty-two settings in nine groups, and the six things they add up to. The names in bold are the names in the indicator’s settings window.

Today’s high and low of the day, live midpoint

Day high and Day low draw the high and low of the trading day, live; with Session on RTH they are the regular session’s high of the day and low of the day, the HOD and LOD. Every % level is measured from that range, so all move with each new extreme. The midpoint, the 50% midline, is on out of the box. Day open and Day close add the first price of the day and the last price of a finished one.

Any % level of the range you type

Custom level 1 (%) to Custom level 10 (%) take any percent of the range: 0 is the low, 100 the high, 61.8 or 73.2 anywhere between. Type +50 (or 150) for half a range above the high and -50 for half a range below the low, up to 1000% either way. Mirror levels beyond the range, on by default, draws each extension on both sides, and every level has its own line style.

Quarters, thirds, eighths and Fibonacci levels

Extra levels adds a whole set in one setting, each spanning the range from low to high: Quarters every 25, Thirds at 33.3 and 66.7, Eighths every 12.5, Fibonacci 23.6, 38.2, 50, 61.8 and 78.6. None is the default. The set shares one style, Extra level lines, dotted silver out of the box, and a custom level typed at the same percent takes over that line with its own style.

Overnight, premarket or RTH high and low

Session sets the hours of the range: Full_Day, the default, is the chart’s own hours. Overnight is 18:00 to 09:30 New York, the premarket on index futures, with Asia and London as its halves, through every clock change. RTH uses NinjaTrader’s regular-hours template, where the instrument has one, for RTH levels on a full-session chart. Use custom session with a Start time and an End time measures any window.

Yesterday’s range, and up to ten days

Previous day’s levels (PD) draws yesterday’s finished range across today’s price, fixed and labeled PD or Prev. Previous days to show, from 0 to 9 and 1 by default, adds earlier days, each on its own session. Extend today’s lines to the right runs today’s lines on to the price scale, and Extend previous days’ lines to the right does the same for earlier days. Show current day off hides today’s own lines.

Labels and an info box

Show labels turns the labels on every line on or off in one click. Show session and day (RTH, PD), Show level (High, Open, 50%) and Show price build each label, as in PD High 6482.25. Show info box lists the day’s range, the distance from the open and the distance to every level, in points, ticks or percent, with its own font, Box color and Box opacity (%). Position picks its corner; labels step aside for it.

Today’s range, measured on your chart.

Free, no card, no license key. Download it, import it, and today’s levels are on your chart in under a minute.

Not for you if you want the tool to tell you when to buy and sell. Live Range Levels shows where price sits in the range; the reading, and the trade, are yours.

Pairs well with Free previous day high and low indicator (Daily H/L Lines) · Free initial balance indicator (Live IB Range) · Key levels indicator (Intraday Reference Levels) · Session high low indicator (SessionLevels)

We also offer custom builds

Can’t find the tool you need? We’ll build it.

Tell us what you want to see on the chart. You get a fixed price and a written plan before any work starts.

Request a free quote

Every tool on this site started as an idea like yours.

A key levels indicator we built, on a NinjaTrader chart A moving-average zones indicator we built, on a NinjaTrader chart A VWAP indicator we built, on a NinjaTrader chart