What Is a 2000 Tick Chart? How to Set Up Tick Charts in NinjaTrader 8
A tick chart closes a bar after a set number of trades instead of a set number of minutes, so the chart speeds up when the market does and slows down when it goes quiet. Here is what that means in practice, how to set one up in NinjaTrader 8, what data it needs, how it compares to time, range and volume bars — and why the chart I trade ES on is a 2000-tick chart.
What a tick chart is
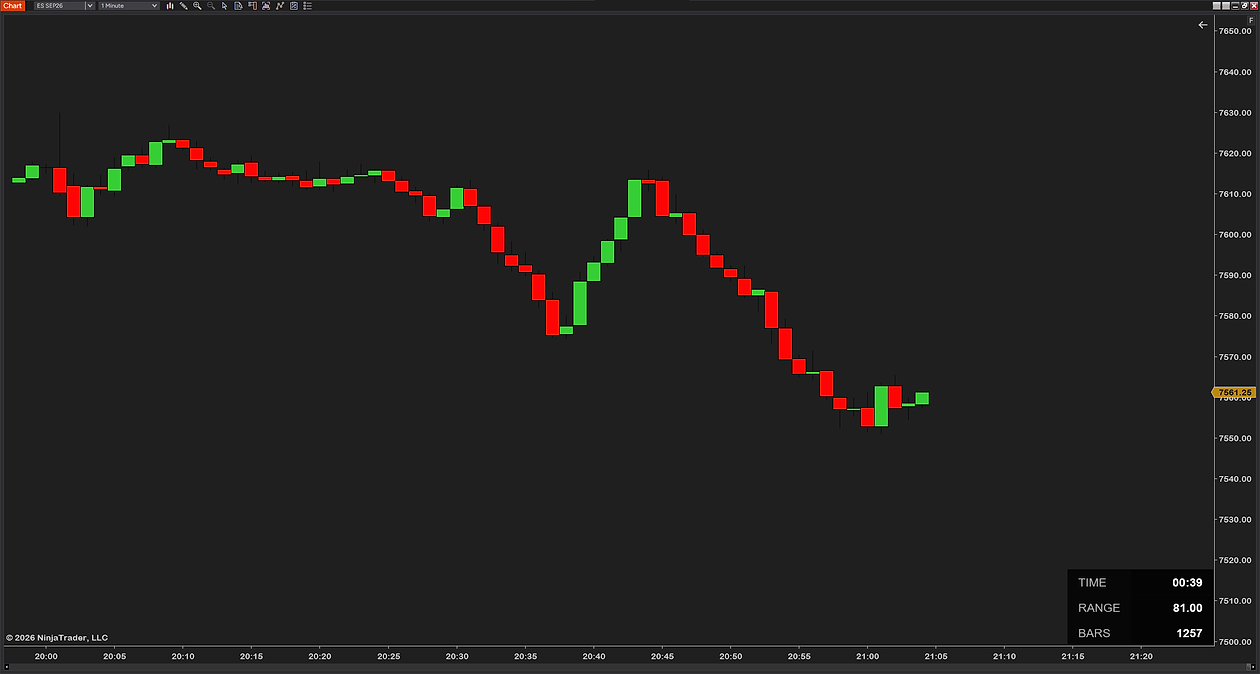
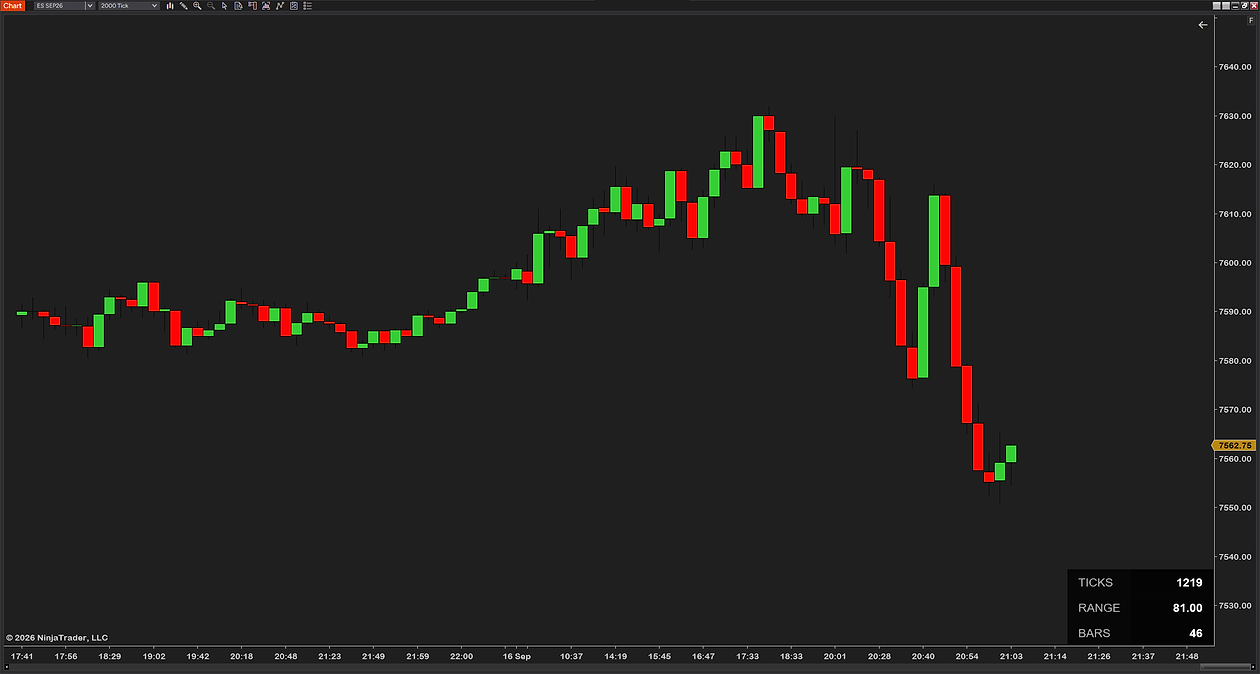
On a time chart a bar closes when the clock says so — every five minutes, say — whether the market traded ten thousand contracts in that window or ten. On a tick chart a bar closes when a set number of trades have printed. That number is the chart’s setting: a 500 tick chart closes a bar every 500 trades, a 2000 tick chart every 2000.
One word of caution about the word itself. In this context a tick is one trade — one print on the tape, whatever its size — not the minimum price movement. The “tick” in “ES moves in quarter-point ticks worth $12.50” is a different thing, and searches for a “tick value chart” are usually looking for that dollar-per-tick table, not for this kind of chart. NinjaTrader’s own tick counter counts trades, and so does every tick bar.
The consequence is the whole reason people use them: the chart runs at the speed of the market. At the open, when trades are flying, bars complete in seconds and the chart shows you the structure of the move in detail. At lunch, when nothing is happening, one bar can take five minutes and the chart stops inventing detail that is not there.
What a 2000 tick chart is, and why I trade ES on one
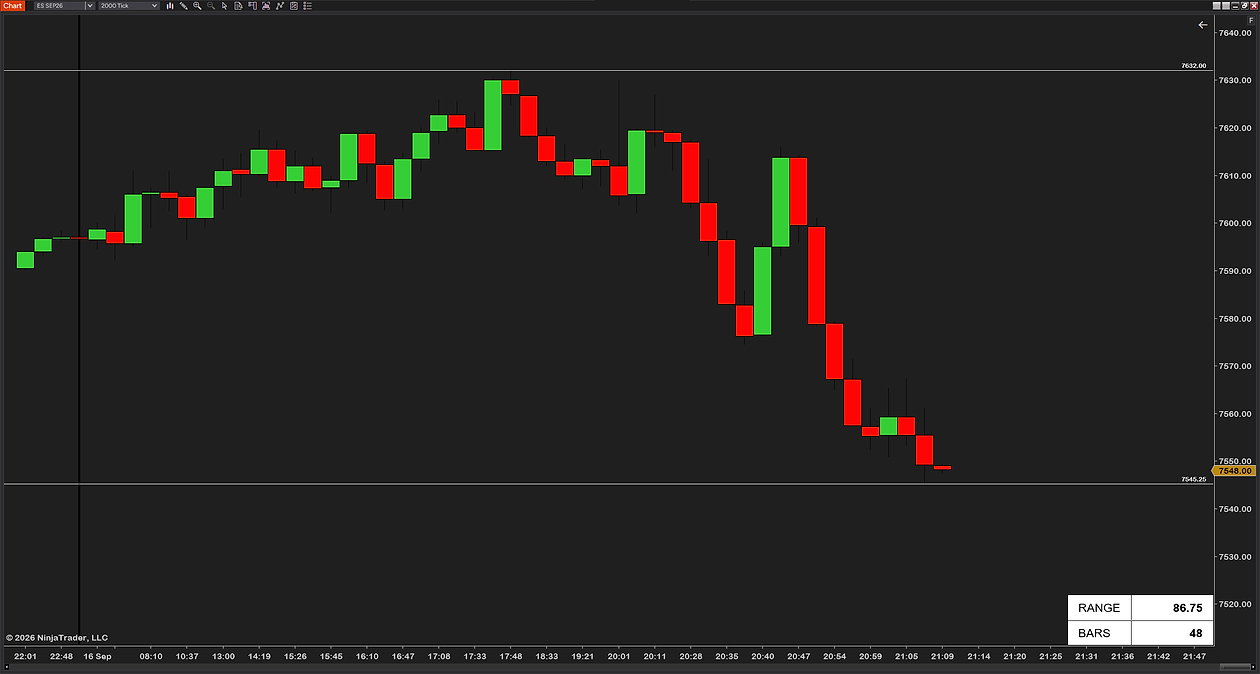
A 2000 tick chart is simply a tick chart with the value set to 2000. On the ES it is a common choice for intraday trading, and it is the one I have traded for seven years, for a reason that has nothing to do with magic numbers: it is the size at which one bar on ES holds roughly one swing of the kind I trade — a push of a few points — during the hours I trade. Smaller settings show every wobble inside that push; larger ones hide the push inside a bar. That balance is personal, and it is set by what you are trying to see, not by anyone’s recommendation, including mine.
What a 2000 tick chart does that a 5-minute chart does not: in the first half hour after the cash open it will print many bars where the 5-minute prints six, and each of those bars is a real unit of participation. In the afternoon it prints far fewer. The trade-off is that you lose the clock — two bars on the chart are no longer the same distance apart in time — which is why the section on reading it matters.
How many minutes is a 2000 tick chart?
It has no fixed answer, and any page that gives you one is guessing. On ES a 2000 tick bar can take under a minute in the first ten minutes after the open, several minutes through the middle of the day, and longer still in the overnight session. The number changes with the day, the hour and the news.
If you want your own equivalent, measure it instead of asking: count the bars your tick chart printed during one full regular session and divide the session’s minutes by that count. A session of 405 cash-hours minutes that produced 135 bars averaged three minutes a bar — on that day. Do it for a week and you will have a range, which is the honest form of the answer. The free tick counter indicator has a bars-so-far row that does the counting for you.
How to set up a tick chart in NinjaTrader 8
- Right-click the chart and choose Data Series.
- Set Type to Tick and Value to the number of trades per bar — 2000 for a 2000 tick chart.
- Check Load data based on. It is one of Bars, Days, Custom range, Weeks, Months or Years; NinjaTrader’s own description of it is “Determines how historical data is loaded.” For a tick chart, Days with a small Days to load is the sensible start — see the data section for why.
- Check Trading hours. Tick bars follow the template like every other bar, so this decides where the session starts and which bars belong to which day — the trading hours guide explains the choice.
- Click OK. The chart reloads and every bar is now 2000 trades wide.
Other bar types can be built on ticks. Heiken Ashi, Volumetric and Price on volume bars carry a Base period type and Base period value, so a Heiken Ashi chart with a tick base of 2000 is a 2000 tick chart with Heiken Ashi candles drawn on it.
The data a tick chart needs
A tick bar can only be built from tick-level history — every trade, not one-minute summaries — so the chart is only as good as the historical tick data your provider supplies. Load more days than the provider holds and the early part of the chart is simply empty. Load many days of tick data and the chart takes noticeably longer to open, because there are a great many trades in a day of ES. That is why Days to load is worth keeping small on a tick chart: a few days is plenty for an intraday chart, and it opens in seconds.
One setting sounds related and is not: Tick Replay. It does not affect how bars are built. It replays historical trades one by one so that indicators which calculate on every tick can be back-filled tick by tick, and NinjaTrader warns about the cost in its own words: “Tick Replay uses historical tick data to build the Data Series requiring additional PC resources adversely impacting the performance and initial calculation times of indicators and strategies.” Leave it off unless an indicator you rely on specifically asks for it.
Tick charts vs time, range, volume and Renko
| Chart | A bar closes when | What it is good at | What you give up |
|---|---|---|---|
| Time (minute) | The clock reaches the interval | Time-of-day structure; every bar is comparable; every indicator assumes it | Fast moves are crammed into one bar; quiet hours invent detail |
| Tick | A set number of trades have printed | Detail when the market is active, calm when it is not; more even participation per bar | The clock; bar counts are not time; some time-based tools stop working |
| Volume | A set number of contracts have traded | Like tick, but weights big trades more — one 50-lot moves it as much as fifty 1-lots | Same as tick, plus sensitivity to how the feed reports size |
| Range | Price has travelled a set distance | Every bar is the same height; chop compresses into few bars | Both time and activity; a bar can take an hour or a second |
| Renko | Price has moved a fixed brick | Trend is unmissable; noise is filtered by construction | Wicks, time, and the true open and close of each brick |
The choice that matters most in practice is tick versus time, and it comes down to one question: do you want each bar to represent a fixed amount of time or a fixed amount of participation? A scalper reading the opening drive usually wants participation. A trader holding through the day usually wants time. Plenty of people keep one of each open and use the time chart for context.
Every bar type NinjaTrader 8 ships
For reference, the full list in the Data Series Type dropdown, from NinjaTrader’s own definition: Tick, Volume, Range, Second, Minute, Day, Week, Month, Year, Heiken Ashi, Kagi, Renko, Point and Figure, Line Break, Volumetric, Delta and Price on volume. Only Tick is tick-based by itself; Heiken Ashi, Volumetric and Price on volume become tick-based when their base period type is set to Tick. Everything from Second to Year is time-based, and the rest are price-based.
Reading a tick chart: ticks left and bars since the open
Two numbers replace the clock on a tick chart, and NinjaTrader gives you one of them out of the box.
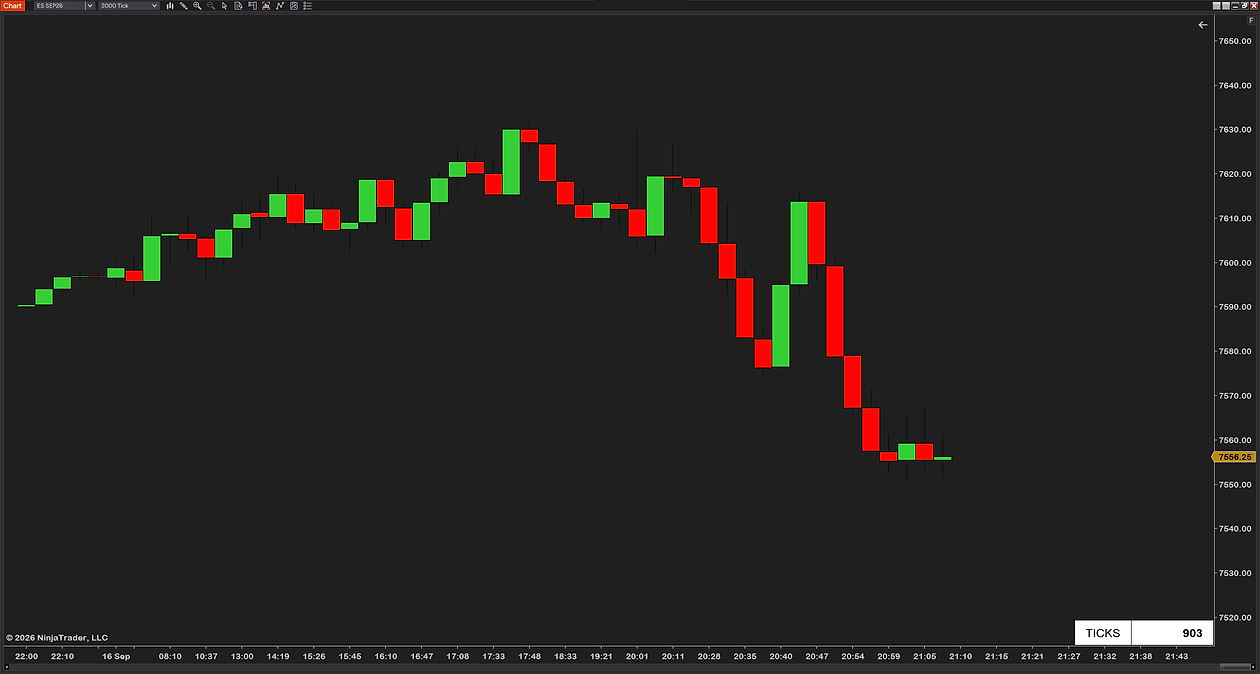
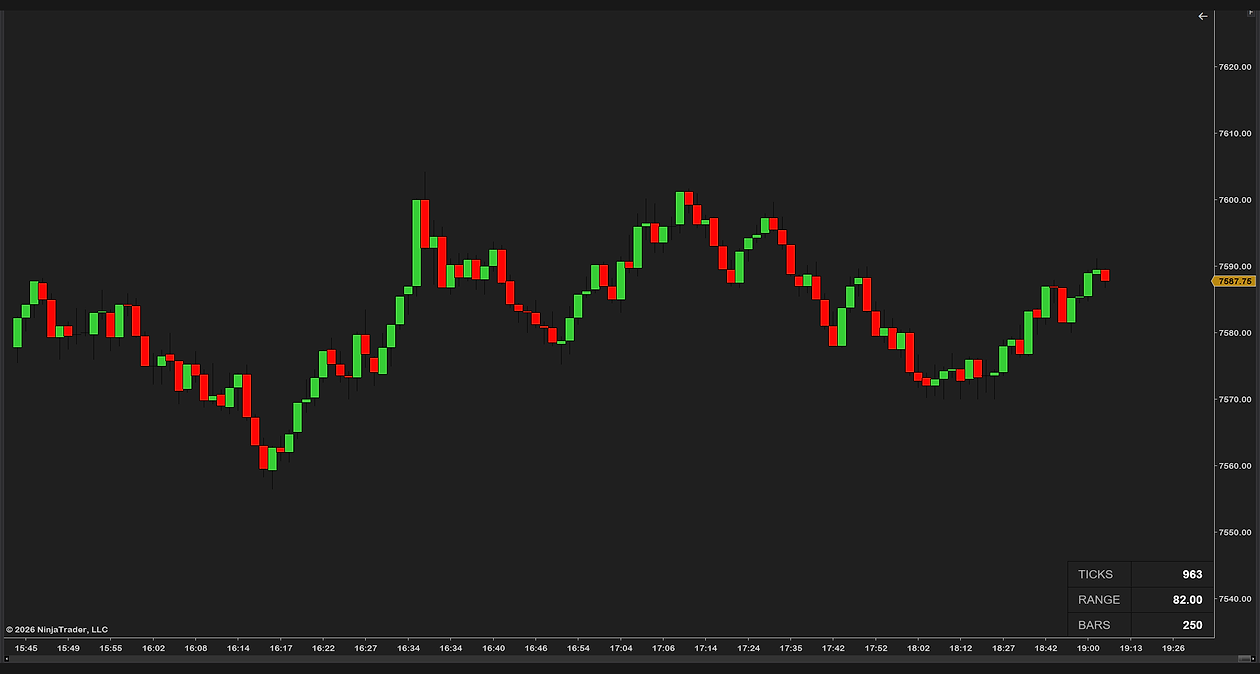
- Ticks left on the bar. Because a bar does not close on a schedule, you cannot tell from the axis whether it is about to finish. NinjaTrader’s built-in Tick counter shows the trades remaining; it has three settings and some limits, and it is the subject of its own guide.
- Bars since the open. On a time chart bar 12 is always 10:25. On a tick chart bar 12 is wherever the twelfth block of trades ended, so the count measures how much has happened since the open rather than how much time has passed — a different and, for a scalper, often more useful number. Bar counting covers it.
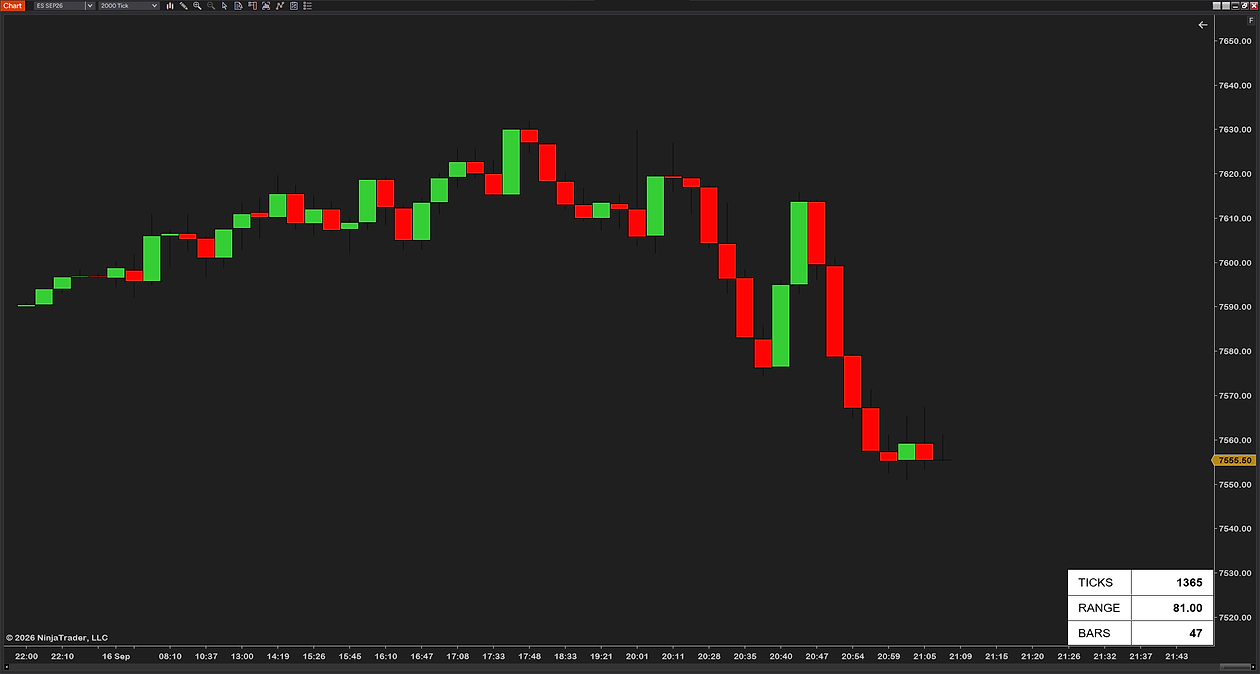
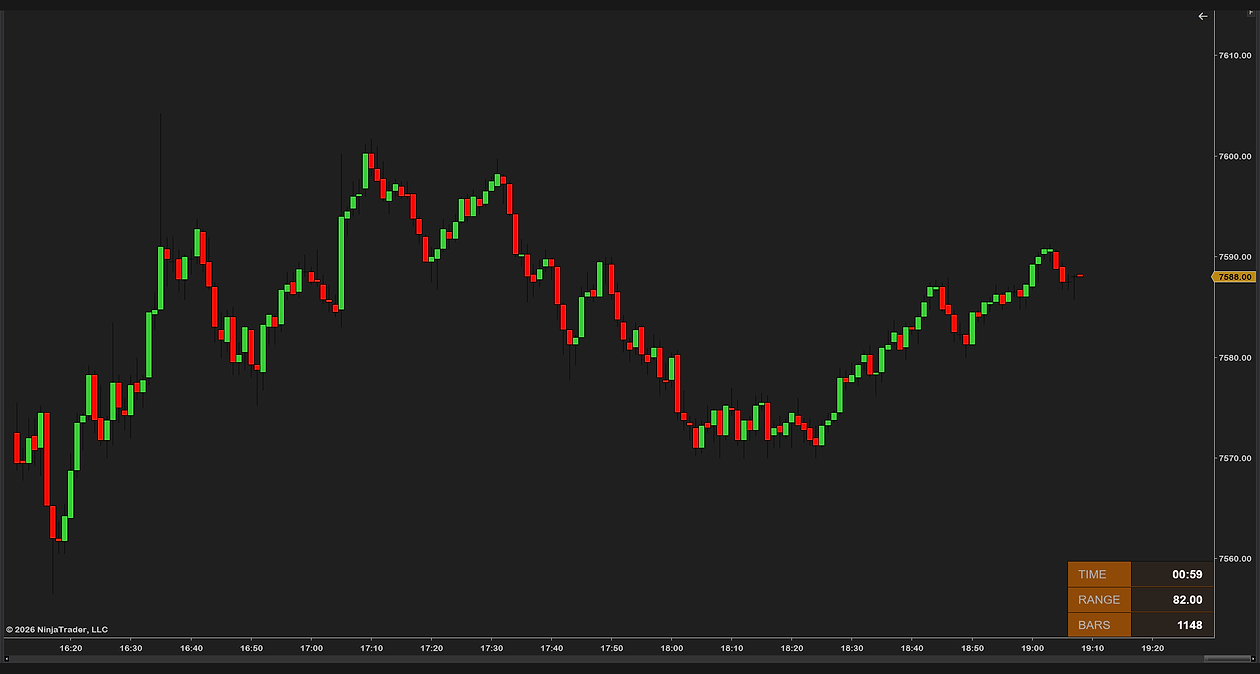
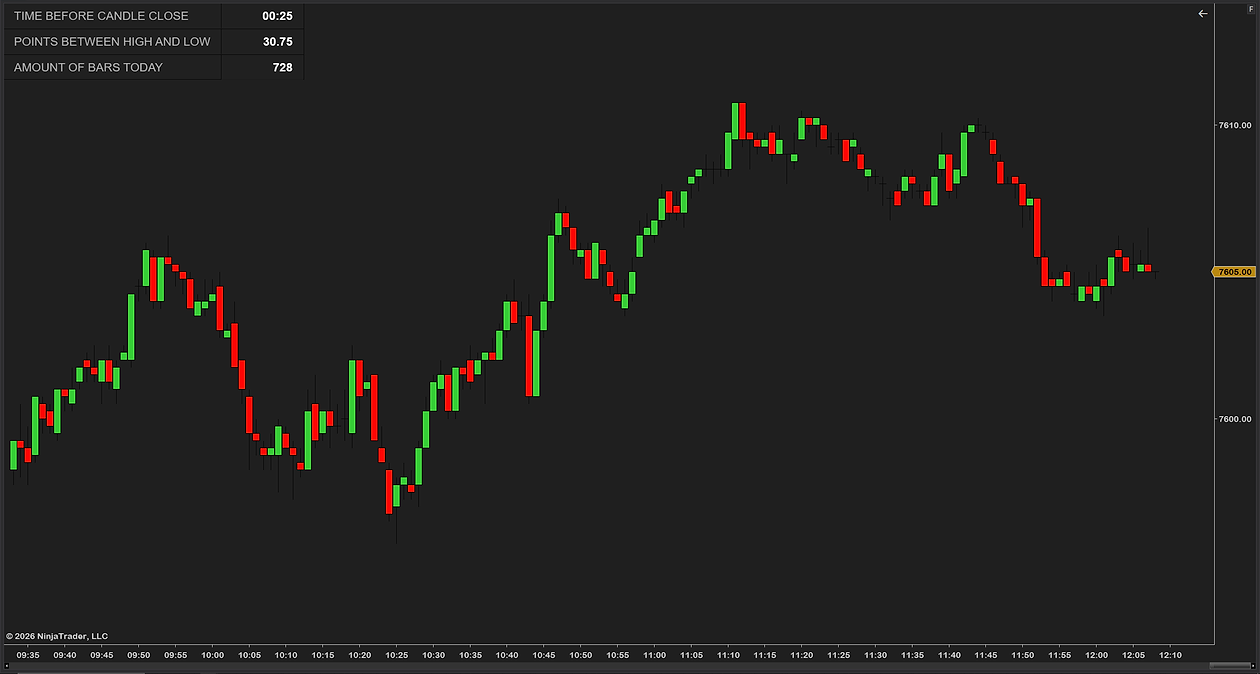
Our free tick counter indicator puts both on one panel — ticks left, the bar’s range and the bars so far in the session — in a corner you choose, at a size you can read, and it switches itself to a time countdown if you flip the same chart to minutes.
Which tick size to pick
There is no correct number, only a correct number for how long you hold. Three rules of thumb that have held up:
- Match the bar to the move you trade. If one bar regularly contains the whole move you are trying to catch, the setting is too large; if a move takes twenty bars to play out, it is too small. For a few-point ES scalp, somewhere in the low thousands is where most traders land; for a swing that runs all morning, larger.
- Bigger is smoother, smaller is faster. A 500 tick chart flips its short-term reads constantly; a 4000 tick chart is calm and late. Neither is wrong.
- Pick one and keep it. The value of a tick chart is learning what its bars mean on your instrument at your hours, and that takes repetition. Changing the number every week resets the learning.
Three mistakes worth avoiding
- Reading bar counts as time. Twenty bars on a tick chart is twenty blocks of trades. It was ten minutes yesterday and forty today. Anything you learned about “bar 18” on a 5-minute chart does not transfer.
- Expecting time-based tools to work. NinjaTrader’s Bar timer, for one, is built for time-based bars and prints a message instead of a countdown on a tick chart. Session-based tools — VWAP, session levels, the initial balance — are fine, because the session is still the session.
- Loading a month of ticks. A tick chart with thirty days loaded is slow to open and slow to scroll, for history you will never look at. Keep Days to load small and let the time chart carry the context.
Common questions
What is a tick chart?
A chart whose bars close after a set number of trades instead of a set number of minutes. A tick here means one trade on the tape, whatever its size, not the minimum price increment. Bars complete quickly when the market is active and slowly when it is quiet, so the chart shows participation rather than time.
What is a 2000 tick chart?
A tick chart set to close a bar every 2000 trades. On the ES it is a common intraday setting because one bar tends to hold about one swing of a few points during regular hours. In NinjaTrader 8 it is Data Series, Type Tick, Value 2000.
How many minutes is a 2000 tick chart?
It varies with activity, so there is no fixed equivalent. On ES a bar can take under a minute after the open and several minutes at midday. To find your own average, count the bars printed in a full session and divide the session's minutes by that number, then repeat for a week to get a range.
How do I set up a tick chart in NinjaTrader 8?
Right-click the chart, open Data Series, set Type to Tick and Value to the number of trades per bar, choose how much history to load under Load data based on and Days to load, check the Trading hours template, and click OK. Heiken Ashi, Volumetric and Price on volume bars can also be built on a tick base through Base period type and Base period value.
Is a tick chart better than a time chart?
Neither is better; they answer different questions. A time chart gives every bar the same duration, which suits time-of-day structure and most indicators. A tick chart gives every bar the same number of trades, which suits reading active periods in detail and staying calm in quiet ones. Many traders keep one of each.
Does a tick chart need special data?
It needs tick-level historical data from your provider, since bars are built from individual trades. Load only as many days as you use, because a day of ES is a very large number of trades and the chart opens slowly with weeks of it. Tick Replay is a separate setting for back-filling tick-by-tick indicators and does not change how bars are built.
Which indicators do not work on a tick chart?
Anything built around the clock. NinjaTrader's Bar timer is intended for time-based bars and prints a message instead of a countdown on a tick chart; use the Tick counter instead. Session-based tools such as VWAP, session levels and the initial balance work normally, because the session template still defines the day.
Related guides
- How to see ticks left on the bar — NinjaTrader’s built-in tick counter, its three settings, and where it stops.
- What is bar counting? — numbering bars from the open, and what the count means on a tick chart.
- How trading hours work in NinjaTrader 8 — the template that decides where a tick chart’s day begins.
The honest part
A tick chart will not make a bad read good. It changes what a bar means, and for some ways of trading that is a real advantage: the opening drive on ES is simply easier to read when every bar is a fixed amount of participation. For others it is a distraction from the clock that actually drives their setups. Try one for a week alongside your time chart, with the same tick value every day, and you will know which trader you are. I found out I was the first kind, and I have not changed the number since.