EMA Color Zones

Free
Free NinjaTrader 8 indicator NinjaTrader 8 Indicator

EMA cloud for NinjaTrader 8: colored zones between four averages, trend, pullbacks and chop at a glance

No machine ID No license server No repaint Instant download Free updates Verified on NinjaTrader 8.1.8.2 · 4 Sep 2026
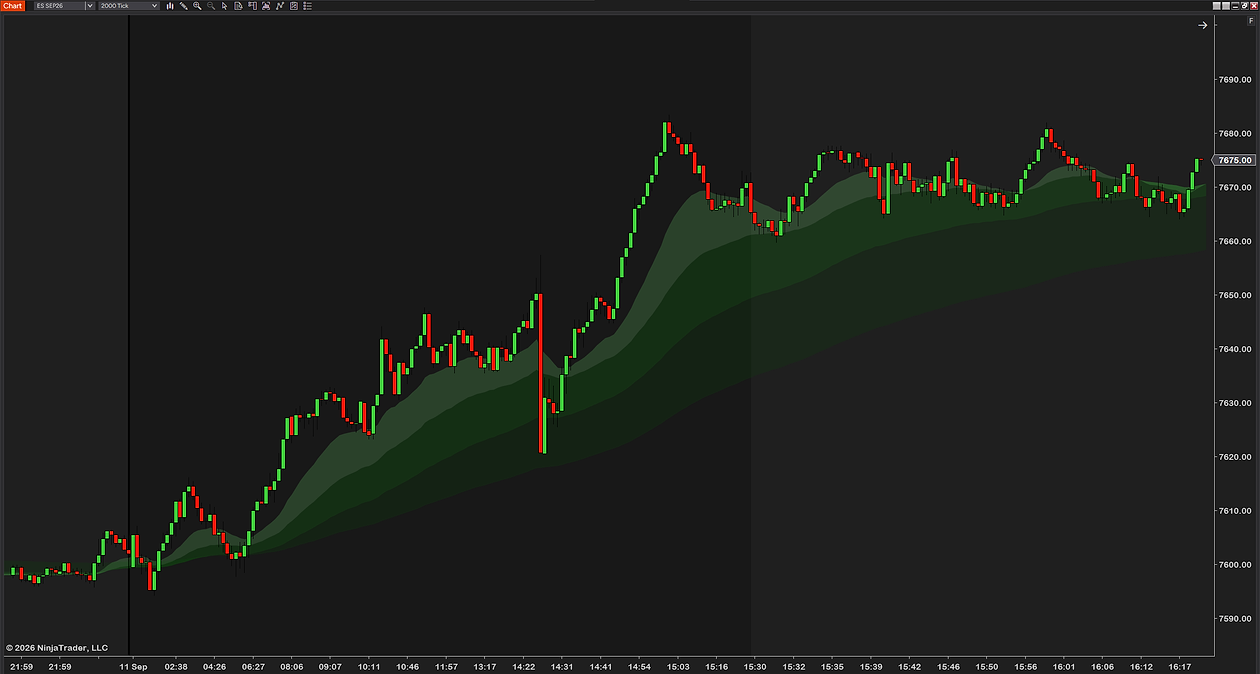
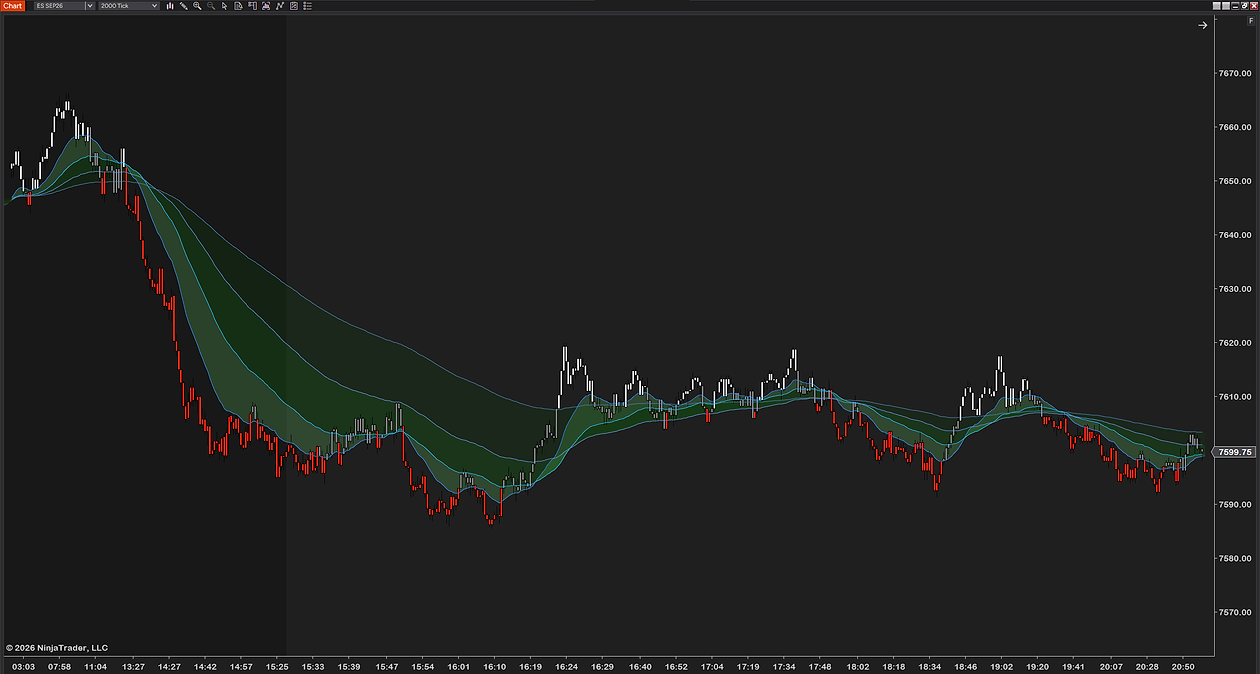
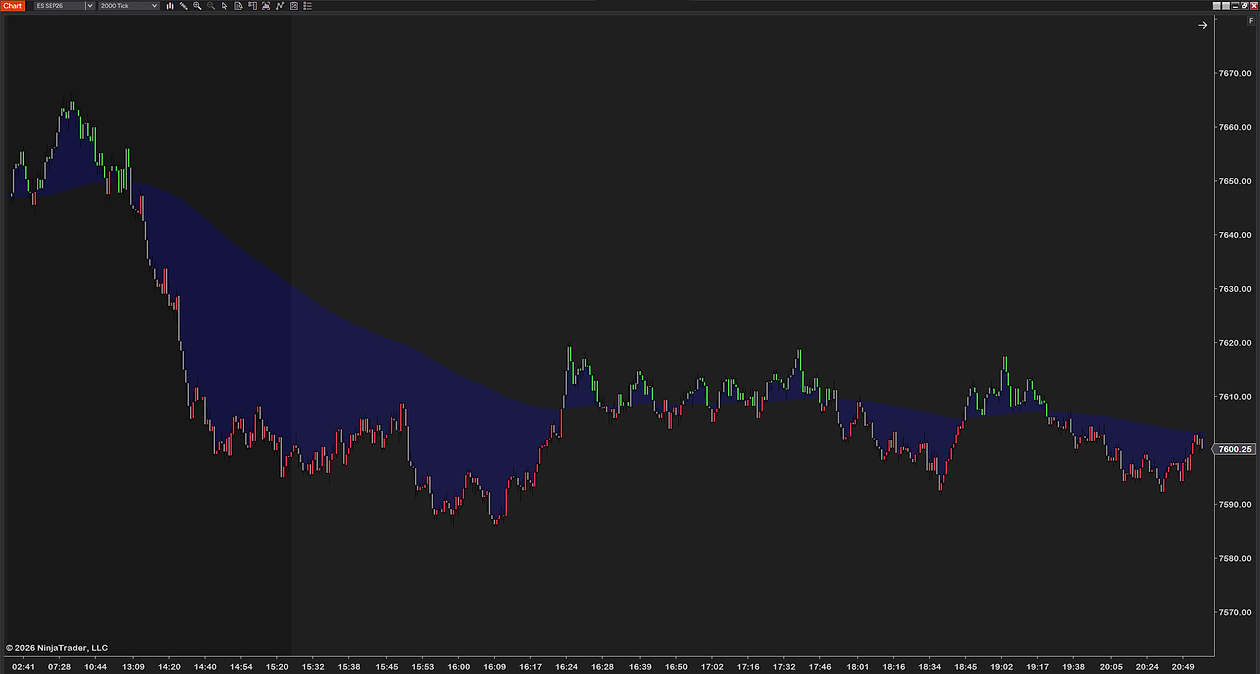
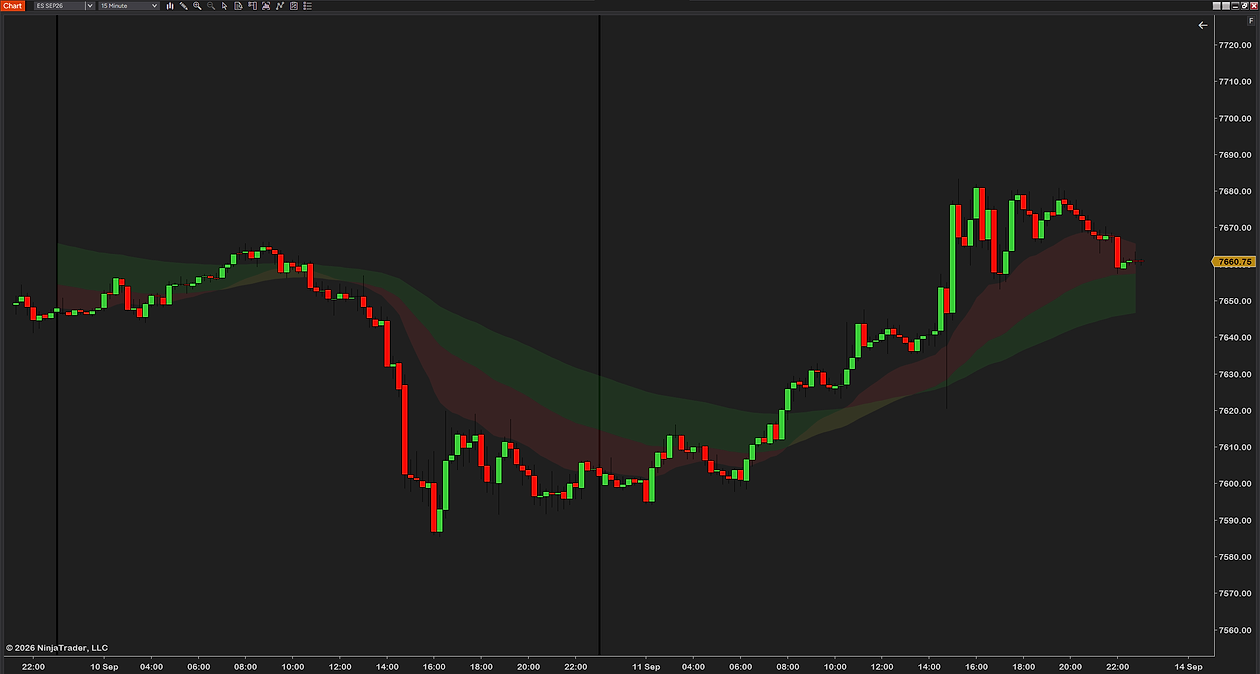
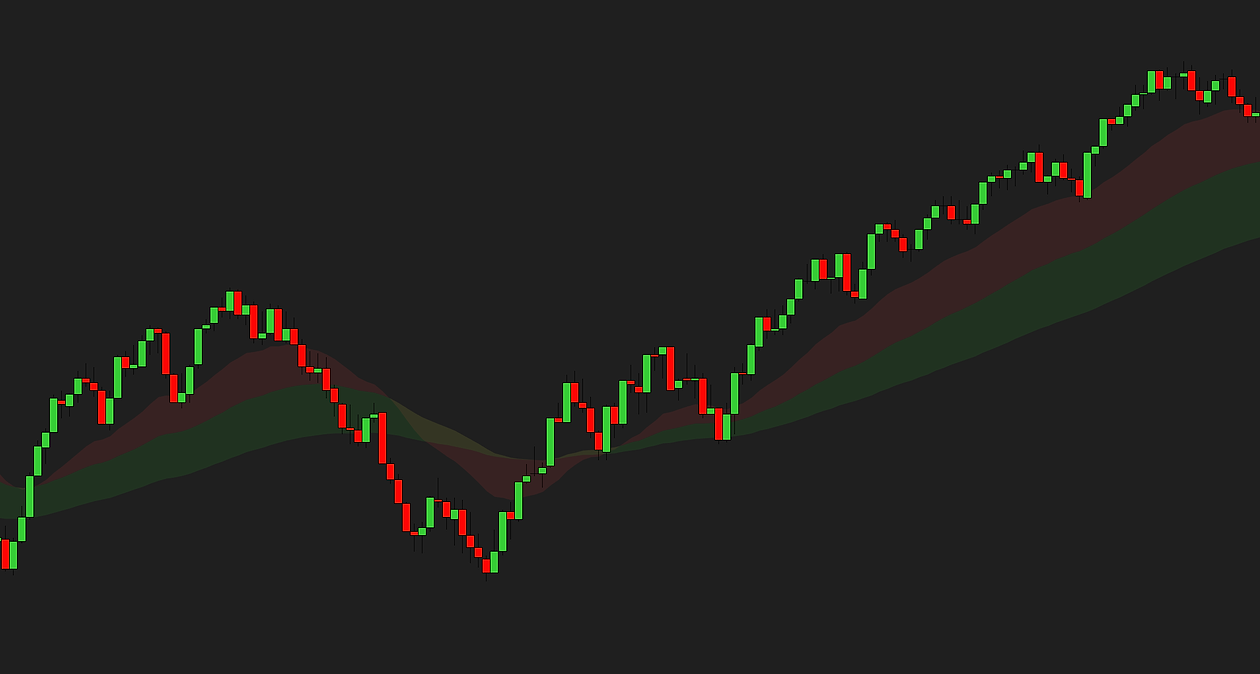
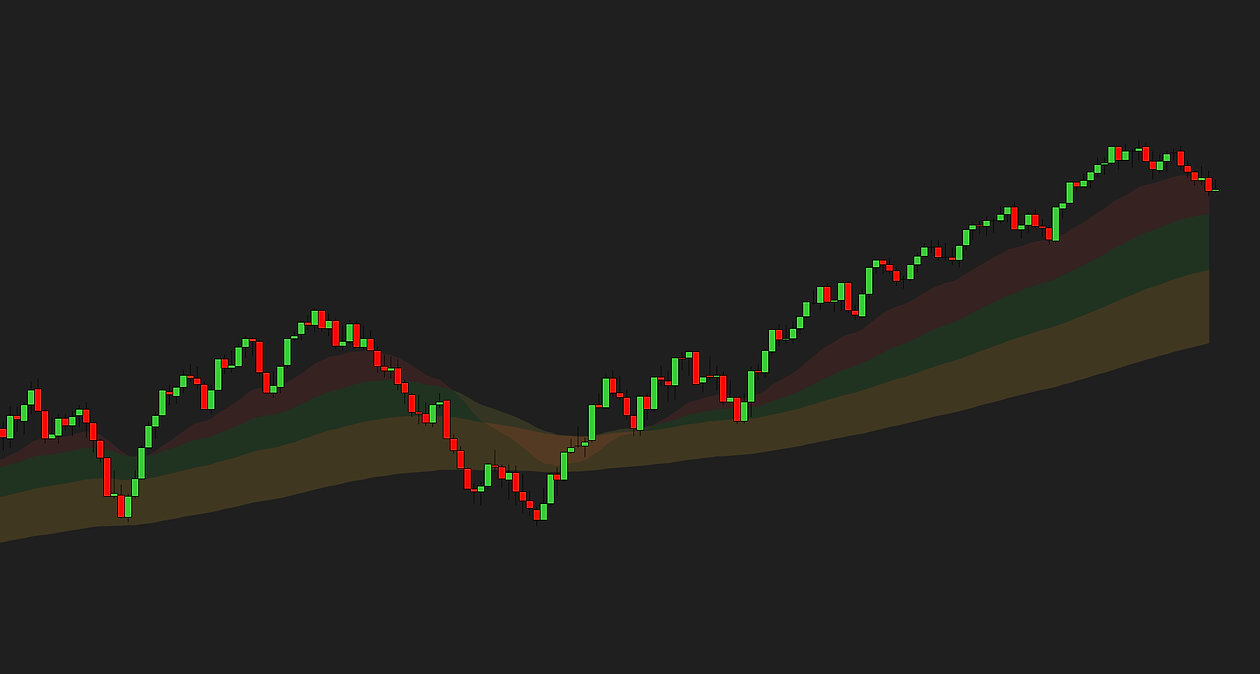
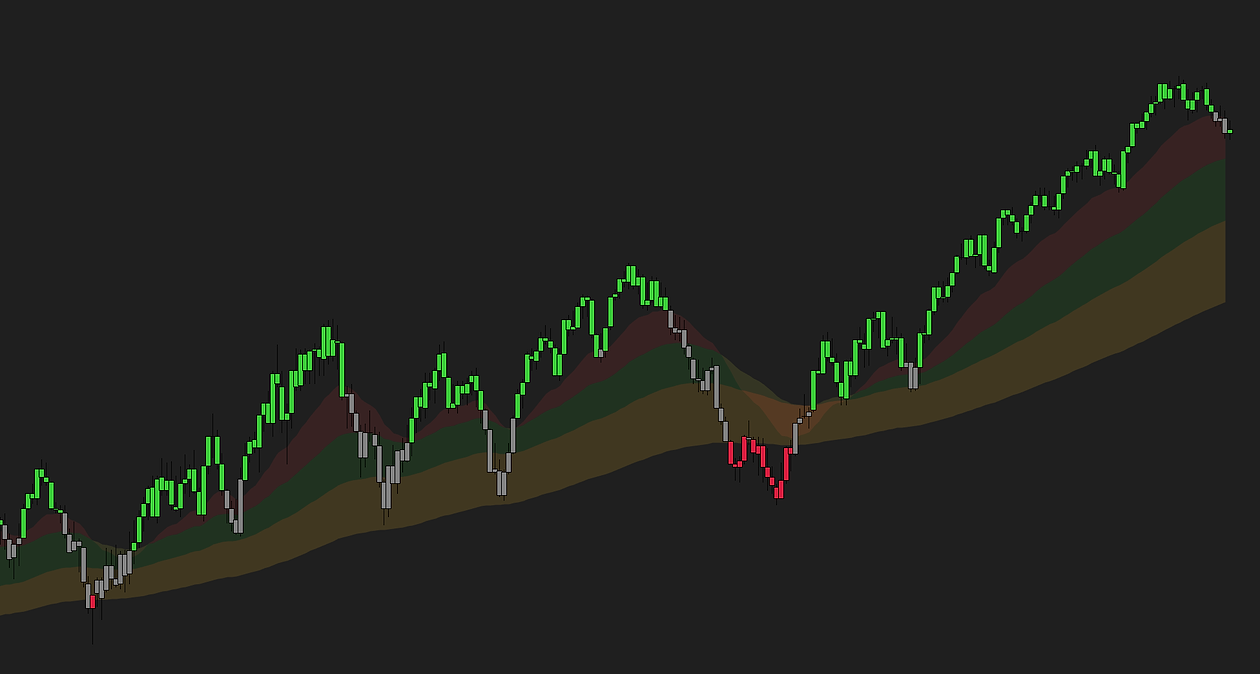
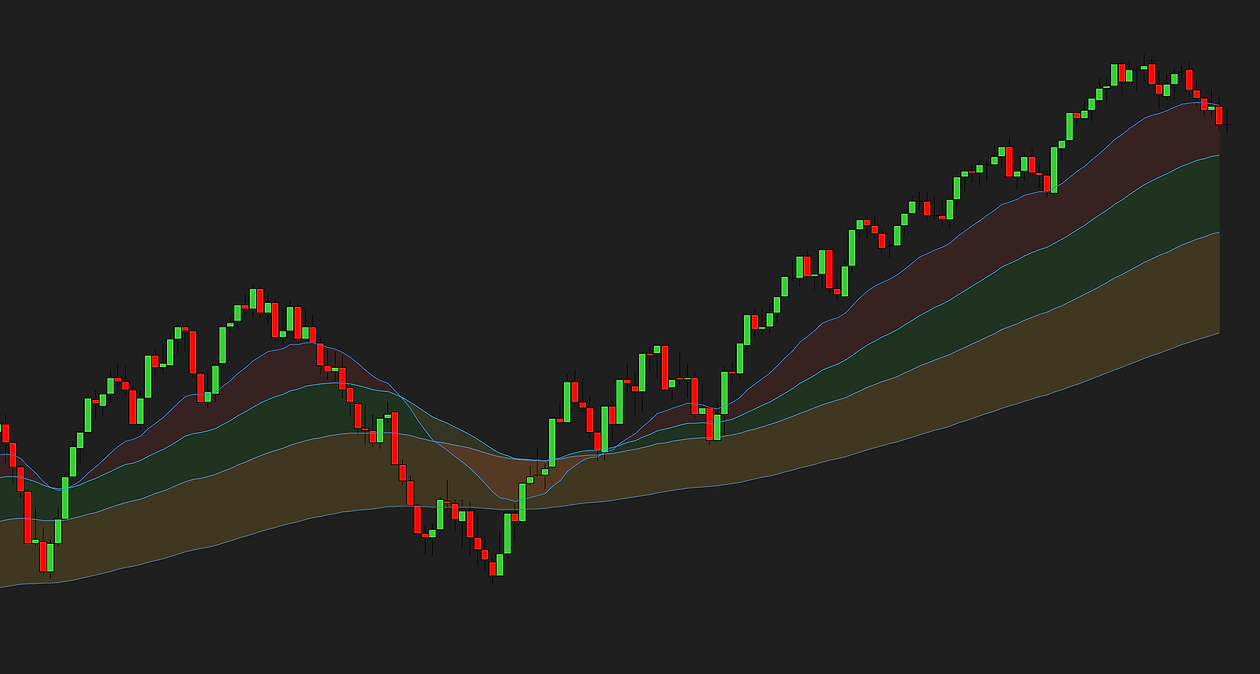
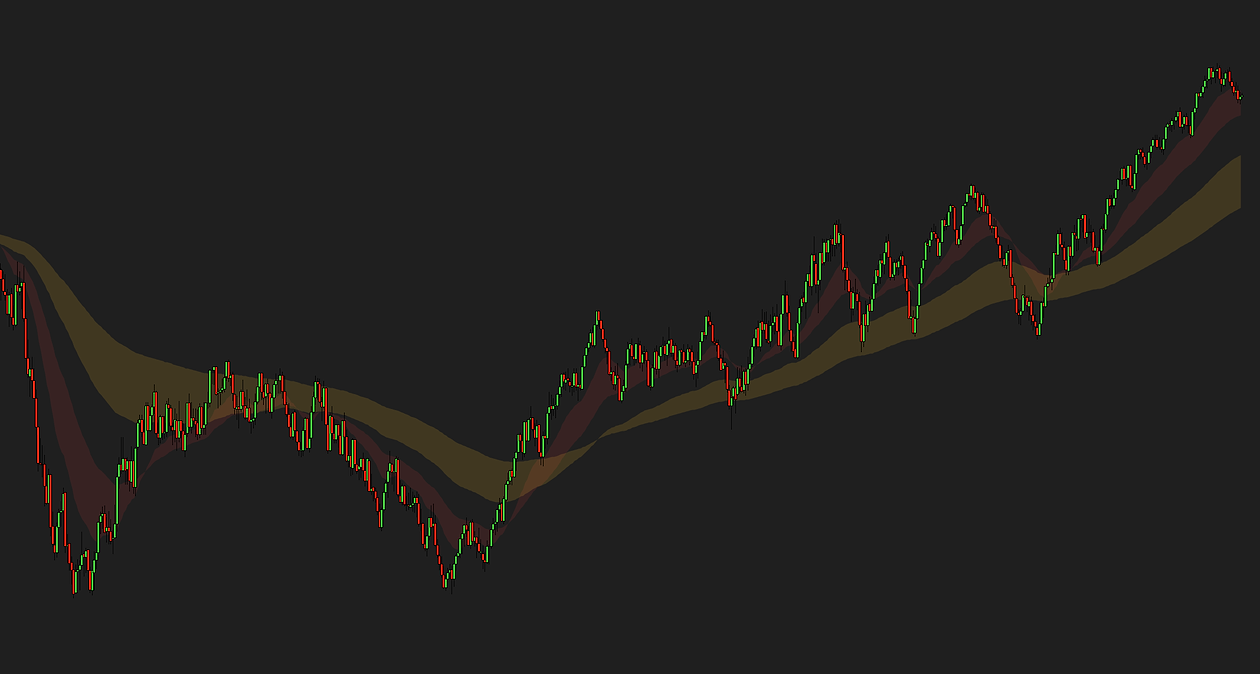
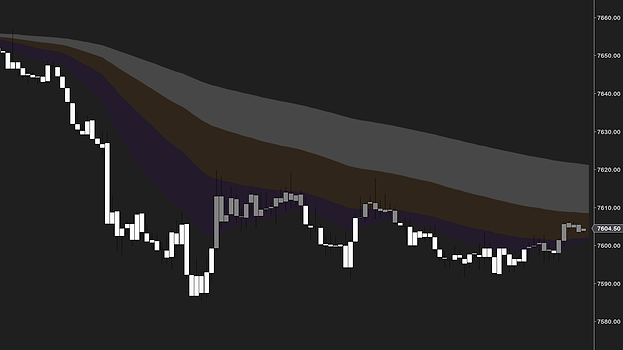
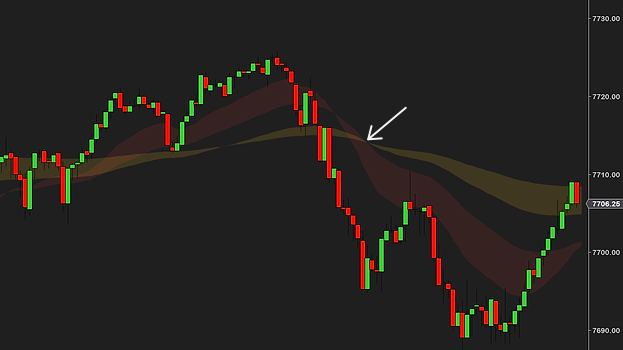
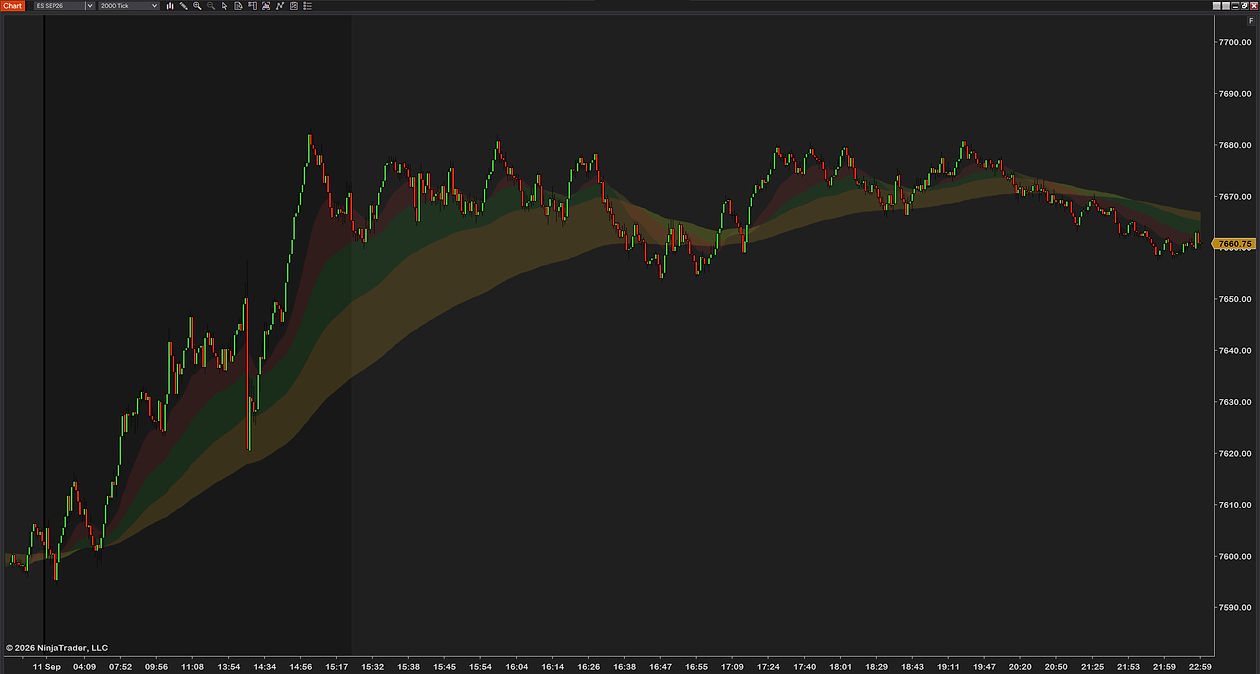
EMA Color Zones on a 2,000-tick ES chart: a full trend day up, the three zones turning from red to green and fanning out as the moving averages spread EMA Color Zones in a strong uptrend: the green zones stacked wide under price, narrowing in the pause and widening again on the next leg EMA Color Zones with paint bars on: neutral candles in white through a sell-off and the chop after it, the four moving-average lines visible between the zones EMA Color Zones with a custom palette: a single deep-blue zone through a decline and the sideways drift that follows EMA Color Zones on a 15-minute chart across two sessions: a slow turn from red to green, the zones pinching into the low and opening on the way up EMA Color Zones — color-filled trend zones between moving averages on a NinjaTrader 8 chart EMA Color Zones — three shaded zones fanning out in a trend and pinching in the chop EMA Color Zones — paint bars coloring candles bullish, neutral or bearish with the zones EMA Color Zones — zones with the four moving-average lines visible EMA Color Zones — a custom minimal look with fewer zones through trend and squeeze
1 / 10

Any zoneAny values8 MA types

Zone 3 pullback between the 100 EMA and 200 EMA. Deeper pullback.
Zone 1 pullback between the 14 EMA and 21 EMA.
Pullback at Zone 2 bottom / Zone 3 top, right at the 50 EMA.
After price has been trending bullish for a while we see a pullback reaction in Zone 1 between the 14 EMA and 21 EMA.

Test how it works

Type
MA 121
MA 250
MA 3100
MA 4200
Lines
Zones
Zone 1
Opacity18
Zone 2
Opacity18
Zone 3
Opacity18
Bars
Paint bars
MA type = EMAValues = 21 / 50 / 100 / 200EMA Color Zones

What it adds to a basic EMA ribbon.

The zones Basic ribbon EMA Color Zones
Four moving averages, own period each fast scalping averages or slow swing ones✓✓
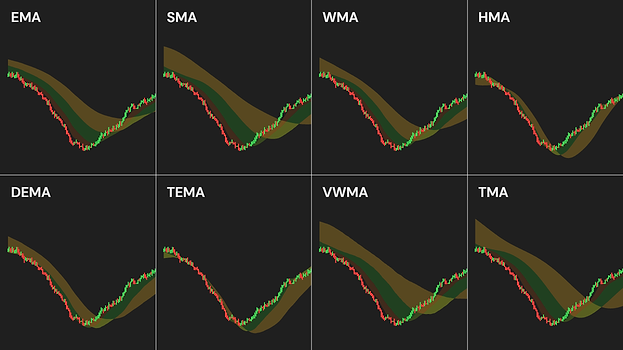
Eight MA types EMA, SMA, WMA, HMA, DEMA, TEMA, VWMA, TMA✓
Four price inputs close, HL2, HLC3 or OHLC4✓
Three shaded zones between the averages each with its own color and opacity✓✓
Reads the trend for you
Zones fan out in a trend, pinch in the chop the shape is the signal, not a line cross✓
Paint bars candles colored bullish, bearish or neutral with the zones✓
Cross alerts when price crosses one of the four averages, with a cooldown✓
Correct by design
No repaint a closed bar never redraws✓✓
Lean on long charts the heavy drawing is skipped on history, so weeks of 1-minute bars load instantly✓
Days to show limit how far back it draws✓
Yours to set
Every line and zone toggles on its own two averages and one zone, or all four and three✓✓
Every color and opacity is yours nothing is hard-coded✓
Free, with free updates no trial, no locked settings, no upsell✓
Works on
Chart types
Tickany count
Minuteany, up to daily
Volumeany size
Range, Renkoany size
Instruments
Futuresall exchanges
Stocksand ETFs
FX and cryptono volume needed
Data providerany
Needs
NinjaTrader 8any recent version, free included
Dataprice only, no volume
Licensenone, nothing to activate
Machine IDnone

In short: NinjaTrader 8 and a chart. That is all EMA Color Zones needs.

Moving averages need a little history to settle: on a fresh chart the zones appear once the longest period has enough bars behind it.

Every setting, group by group.

EMA Color Zones has 34 settings in its properties panel. The names in bold are the names you will see there.

An EMA cloud from four moving averages

MA 1 period to MA 4 period (21, 50, 100 and 200 by default) are the four averages the cloud is built from; each has its own MA n show line switch (off by default, the zones carry the picture) and MA n color. Any periods you trade — 9 and 21 for scalping, 50 and 200 for swings.

Three zones, each its own color and opacity

Zone 1 enabled (MA 1 → MA 2), Zone 2 enabled (MA 2 → MA 3) and Zone 3 enabled (MA 3 → MA 4) fill the space between each pair of averages, with a Zone n color and Zone n opacity % (18 by default) each. Zones 1 and 2 are on out of the box; the fast zone can be loud and the slow one a faint background.

Eight MA types and four price inputs

MA type builds every line from the same average: EMA (default), SMA, WMA, HMA, DEMA, TEMA, VWMA or TMA — VWMA needs volume, so keep it off forex and CFDs. Price input is the close, HL2, HLC3 or OHLC4. One setting changes all four lines and all three zones together.

Bar coloring: bullish, bearish, neutral

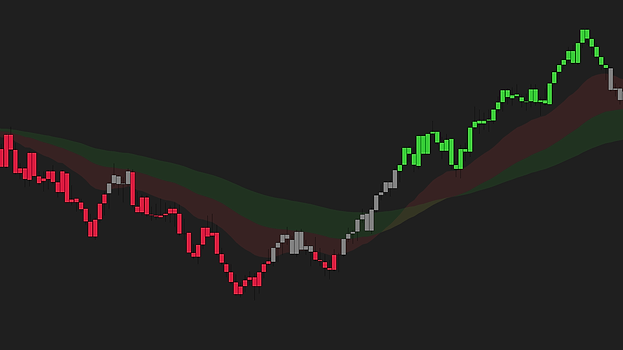
Paint bars enabled (off by default) colors each candle by where it closes against the averages: the Bullish color (above all MAs), the Bearish color (below all MAs), or the Neutral color (inside zones) — so the bias reads even when price hides the zones.

Alerts when price crosses an average

Alerts enabled (off by default) fires a NinjaTrader popup and sound when price crosses an average: Alert on MA 1 cross (on), Alert on MA 2 cross, Alert on MA 3 cross and Alert on MA 4 cross each switch on their own. Cooldown (seconds), 30 by default, stops a chopping bar from ringing every close.

Lean on long charts, no repaint

Days to show (2 sessions by default) limits how far back the zones are drawn, and the heavy drawing is skipped on history, so weeks of 1-minute bars load at once. It calculates on bar close: a closed bar never redraws. Tick, minute, volume, range and Renko charts, price only, no volume needed (except for the VWMA type).

Get EMA Color Zones on your chart

You might ask: why is this free, what is the catch? There is none. We want to change the market for third-party NinjaTrader tools, and giving our work away is part of how we do it.

To say it plainly: this market is overpriced and full of low-quality tools with missing features and bugs. Vendors charge hundreds of dollars for simple indicators. No indicator, add-on or tool will make you profitable. A good one makes your trading environment better, and you know that already, or you would not be here looking.

Our goal is the highest-quality products we can build, tools that make a real difference on the chart. We get there by testing hard: weeks on live charts before release, feedback from the traders who use them, and a close read of what the forums complain about. We offer a full refund within 14 days, we adapt tools for customers who ask, and we give most of our work away.

Most of our tools are free for a reason. We want you to try them, see the quality and the features for yourself, and not spend a dollar with us until you think a tool deserves it. We are a business and we intend to make money, by solving real problems for traders.

So yes, EMA Color Zones is completely free, no strings attached. If you like it, there are more free tools and paid ones priced well under what is usual in this market. Leave a review if you want to, good or bad, we read every one. If you have any questions, please email us at [email protected].
Free download

$0/forever

No card, no license key, no expiry. Nothing to cancel because nothing was started.

Download free
Included:
  • Every setting, every color, every zone
  • Free updates
  • Support by email — answered within a day
  • Same install as the paid tools — one zip, one import
  • No license server, no machine ID

Delivered by Creem. The download link lands on the next page and in your email.

How traders use it

Four ways to read one honest picture of the trend. None of them is a signal; the entries, the stops and the discipline are still yours.

Before the entryThe trend check

One half-second glance: are the zones stacked in your direction? Trading with the stack is trading with the averages. Against it, you had better have a reason.

In the trendThe pullback bounce

Price dips into the zones and holds: the market catching its breath, not turning. A clean picture for buying strength in an uptrend or fading weakness in a downtrend.

ChopThe squeeze

Zones pinch into a flat neutral band: the averages are converging and the trend is stalling. Expect chop or a break; stand down until the zones fan out again.

FilterThe paint-bar filter

Turn on paint bars and let the candle colors do the filtering: full color above or below all the averages, neutral in no-man’s land. Only trade when the bars agree with you.

New to EMA clouds? Read the full guide →

Watch the full walkthrough

Frequent questions.

Question or idea for improvement? Email us, we reply fast.

Genuinely free — no trial period, no locked settings, no license key, nothing to upgrade to. We sell other indicators; free tools like this one are how we show you the quality of the work first.

Download the zip, then in NinjaTrader 8 go to Tools → Import → NinjaScript Add-On and pick the file. Add EMA Color Zones to any chart from the Indicators list, set your periods and colors, and you are running — most traders are done in under a minute. The step-by-step guide covers every message NinjaTrader can show and the update rule.

No. The zones, lines and paint bars are drawn from the moving-average values as they were at the time — history never redraws. By default it calculates when each bar closes, so what a bar drew is what stays; switch NinjaTrader’s Calculate setting to On price change and the live bar updates tick by tick, still without redrawing history.

Yes — tick, minute, volume, range and Renko charts, any instrument, any data provider. It needs no volume data, so it runs the same on anything NinjaTrader 8 can chart.

No, and we won’t pretend it is. It’s a trend-reading tool: it shows you where price sits relative to the averages you chose. You can set an alert for price crossing any of the four averages, but the trade decisions stay yours.

No. Every line and every zone toggles individually — run two averages and a single zone if that’s your style, or all four with three zones.

It’s built lean — the heavy drawing work is skipped on historical bars, so charts load instantly even with weeks of 1-minute data. If your chart ever lags with it on, email us: that’s a bug, not normal.

Both words describe the same picture. The ribbon is the four moving-average lines; the cloud is the shaded space between them. EMA Color Zones draws the cloud as three zones you can color and fade separately, and shows or hides each of the four lines on its own — so it is a cloud, a ribbon, or both, as you set it.

Yes. Set the four periods (MA 1 period to MA 4 period) to 5, 12, 34 and 50. Leave Zone 1 (MA 1 → MA 2) on, switch Zone 2 off and switch Zone 3 (MA 3 → MA 4) on: two clouds with a gap between them, the fast pair for timing and the slow pair for direction. Any periods work the same way — 9/21 with 50/200, or a single zone if that is all you want.

It can. Paint bars enabled (off by default) colors each candle by where it closes against the averages: the bullish color above all of them, the bearish color below all of them, the neutral color inside the zones. Turn it on when you want the bias to read even where price hides the zones; leave it off to keep your own candle colors.

Yes. With MA 4 period at 200, switch Alerts enabled on and Alert on MA 4 cross on: NinjaTrader shows a popup and plays a sound when a bar closes across the 200 EMA, and Cooldown (seconds), 30 by default, holds back a repeat while price chops around the line. Each of the four averages has its own alert switch.

Email support, answered by the traders who built it. Bugs get fixed — this tool gets the same updates and support as our paid indicators.

See the zones on your own chart.

Free, no card, no license key. Download it, import it, and the trend is on your chart in under a minute.

Not for you if you want the tool to tell you when to buy and sell. EMA Color Zones makes the trend impossible to misread; the reading, and the trade, are yours.

Pairs well with Free SuperTrend indicator (ATR trailing stop line) · Multi-timeframe trend indicator (MultiTrend) · ProVWAP VWAP indicator