HTF Candle Overlay

Free
Free download NinjaTrader 8 Indicator

HTF candle and PO3 indicator — higher-timeframe candles over your bars and in a stack beside price, with the time left in each

PO3 stack with countdown CRT lines and sweeps Up to 4 timeframes Tick, range, Renko too v1.0 · Free updates Verified on NinjaTrader 8 · 10 Nov 2026
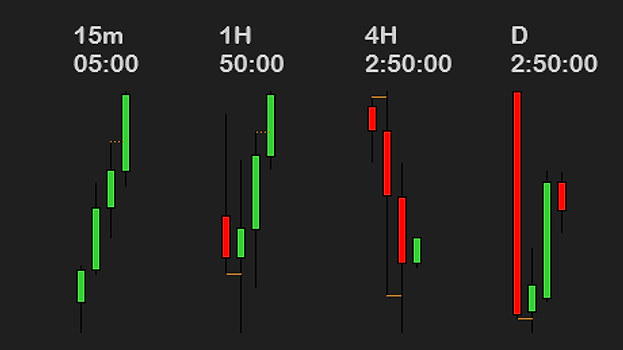
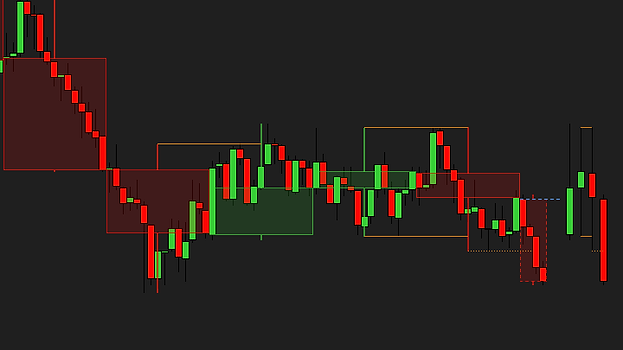
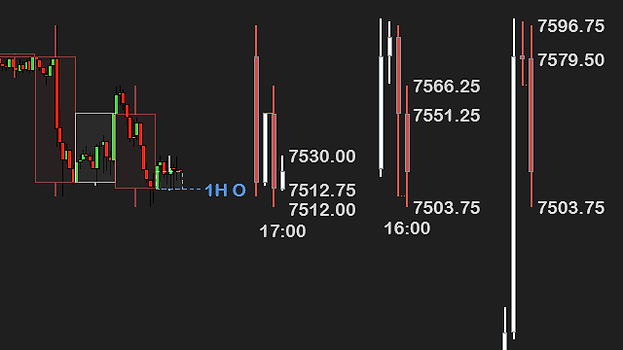
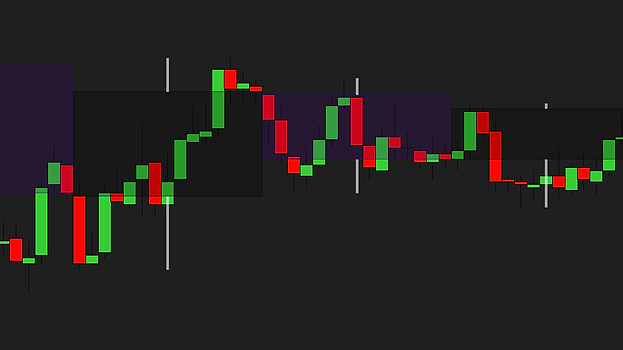
15-minute candles drawn see-through over a 1-minute ES chart, green up and red down, each over exactly the 1-minute bars it holds HTF Candle Overlay on a 1-minute ES chart: 15-minute candles drawn see-through over the bars, and the PO3 stack right of price with 15-minute, 1-hour and 4-hour candles and the time left in each Sweep marks on a 1-minute ES chart: orange lines where a 15-minute candle traded beyond the previous candle's high or low, solid once it closed back inside and dotted while the candle still forms, with the PO3 stack right of price The PO3 stack on a 5-minute ES chart with four timeframes, 1-hour, 8-hour, 12-hour and daily, each with its time left and range, the forming candles' prices and the candle times, and the 1-hour candles over the bars The PO3 stack in a box in the top right corner of an NQ 1-minute chart, 15-minute, 1-hour and 4-hour candles each on its own scale with the time left, and the 15-minute candles over the bars 1-hour candles over two days of a 5-minute ES chart, gray up candles and dark red down candles, with the line at the forming hour's open labeled 1H O 15-minute candles over a 1-minute ES chart with dotted candle start lines at the start of every 15-minute candle 5-minute candles over a 1-minute ES chart, the forming candle with a dashed outline and a line at its open 5-minute candles over a 1-minute ES chart, gray up candles and dark red down candles, with the line at the forming candle's open labeled 5m O 1-hour candles over a 1-minute ES chart in a gray look, the forming hour with a dashed outline and a line at its open labeled 1H O
1 / 10

Higher-timeframe candles + every one over the bars it holds.

0:00 / 0:00
Works on
Chart types
Minute and secondany size
Tick, volume, rangeRenko and Line Break too
Daily and weeklyweekly and monthly candles over them
Instrumentsany, any data provider
Timeframes
Minutes5m to 30m, or custom
Hours1H to 12H
Daily and upDaily, Weekly, Monthly
Automaticup to three, from your bar size
Needs
NinjaTrader 8recent version, free included
Data1-minute and daily history
Licensenone, nothing to activate
Machine IDnone

In short: NinjaTrader 8 and a chart. HTF Candle Overlay builds its candles from NinjaTrader’s own 1-minute and daily data, so they are the same candles on every chart type.

Kagi and point-and-figure charts are not supported, and on a monthly or yearly chart there is no larger timeframe to show. Heikin-Ashi charts are fine, the candles come from real traded prices.

Get HTF Candle Overlay on your chart

You might ask: why is this free, what is the catch? There is none. We want to change the market for third-party NinjaTrader tools, and giving our work away is part of how we do it.

To say it plainly: this market is overpriced and full of low-quality tools with missing features and bugs. Vendors charge hundreds of dollars for simple indicators. No indicator, add-on or tool will make you profitable. A good one makes your trading environment better, and you know that already, or you would not be here looking.

Our goal is the highest-quality products we can build, tools that make a real difference on the chart. We get there by testing hard: live charts, test benches and click tests before release, feedback from the traders who use them, and a close read of what the forums complain about. We offer a full refund within 14 days, we adapt tools for customers who ask, and we give most of our work away.

Most of our tools are free for a reason. We want you to try them, see the quality and the features for yourself, and not spend a dollar with us until you think a tool deserves it. We are a business and we intend to make money, by solving real problems for traders.

So yes, HTF Candle Overlay is completely free, no strings attached. If you like it, there are more free tools and paid ones priced well under what is usual in this market. If you have any questions, please email us at support@usefulindicators.com.

Free download

$0/forever

No card, no license key, no expiry. Nothing to cancel because nothing was started.

Download free
Included:
  • Up to four timeframes, the PO3 stack, the candles over your bars, every line, sweep mark and alert
  • Free updates
  • Support by email — answered within a day
  • Same install as the paid tools — one zip, one import
  • No license server, no machine ID

Your download is on your order page right after checkout.

How traders use it

Four ways to read the higher timeframe without a second chart. None of them is a signal; the entries, the stops and the discipline are still yours.

PO3Power of three, candle by candle

Switch on the PO3 stack and the forming 1-hour and 4-hour candles sit right of price at your chart’s own prices, each with the time left. Set Rows with lines to All rows and a line marks each open, so you see price above or below the open and how far the candle has run.

CRTThe previous candle’s range

The previous candle’s high, low and 50% as lines on your chart. A sweep mark shows when the next candle trades beyond one side and closes back inside. That is the candle range pattern, drawn as it happens and alerted if you want.

Top-downThe bigger candle over your bars

Each 15-minute or hourly candle is drawn see-through over exactly the bars it holds, so you see which of your bars made its high and its low while you trade a 1-minute chart.

TimingOn the clock you trade

Candles that start like NinjaTrader’s (on CME futures the 4-hour candles open at 02:00, 06:00 and 10:00 New York), on the hour from New York midnight, or at a time you choose, with the time left in each one.

New to trading more than one timeframe? Read the full guide →

Frequent questions.

Can’t find the answer to your question? Email us, we answer fast.

Download the zip, then in NinjaTrader 8 go to Tools → Import → NinjaScript Add-On and pick the file. Add HTFCandleOverlay (that is how it is spelled in NinjaTrader’s list) to a chart from the Indicators list, and the higher-timeframe candles are drawn over your bars — most traders are done in under a minute. Tick PO3 stack in section 02 to add the stack beside price. The step-by-step guide covers every message NinjaTrader can show and the update rule.

Genuinely free — no trial period, no locked settings, no license key, nothing to upgrade to. We sell other indicators; free tools like this one are how we show you the quality of the work first.

Open the indicator’s settings and tick PO3 stack in section 02, What To Show. It is off by default, so a fresh chart shows the first automatic timeframe over your bars (15 minutes on a 1-minute chart) with a line at its open; the next two (1 hour and 4 hours there) show in the stack once it is on, and row 4 waits as a Daily row. Right of price is the default place; Position in section 07 also offers the four corners of the chart. The previous candle lines, the candle start lines and every alert are off too until you switch them on.

Yes. The PO3 stack shows the last few candles of each timeframe side by side, right of your chart’s newest bar at your chart’s own prices, so you read the bigger candle’s open, high, low and close the way ICT traders read the power of three (accumulation, manipulation, distribution). Smallest timeframe on the left, 4 candles per row by default (1 to 40), with the timeframe’s name and the time left above each row. It never stretches your chart’s price scale, so a tall daily candle does not squash your bars; it may reach past the chart’s edge instead (a corner box fits every row). It draws the candles; reading the phases is yours.

Yes. Timeframe preset CRT sets the 1-hour and 4-hour rows. Previous candle lines on High, low and 50% draws the previous candle’s range on your chart, Sweep marks show where the next candle traded beyond one side and whether it closed back inside (in the stack, or over your bars too), and the Close back inside alert tells you when it does. It marks the range and the sweep; the entry and the stop are yours.

Yes. Minute and second charts, tick, volume, range, Renko and Line Break charts, Heikin-Ashi charts and daily and weekly charts, on any instrument and data provider. The candles come from NinjaTrader’s own 1-minute and daily data, never from your chart’s bars, so a 1-hour candle is the same on a 1-minute chart and on a 2000-tick chart; where a candle starts inside one of your bars, its edge is drawn part-way through that bar. Kagi and point-and-figure charts are not supported, and a monthly or yearly chart has no larger timeframe to show; it says so in one short note. It draws on charts only, not in the Market Analyzer or a strategy.

Up to four rows, each with its own timeframe: 5, 15 and 30 minutes, 1, 2, 4, 6, 8 and 12 hours, Daily, Weekly, Monthly, or any number of minutes from 2 to 1439 (Custom minutes). The three Automatic choices follow your chart: on a 1-minute chart they are 15 minutes, 1 hour and 4 hours, on a 5-minute chart 1 hour, 4 hours and Daily. Timeframe preset fills the rows in one pick: Scalper, Day trader, Swing or CRT. A row has to be larger than your chart’s bars.

You choose, per row, in Candle start. Like NinjaTrader gives the candles of a NinjaTrader chart of that size on your trading hours (on CME futures 4-hour candles open at 18:00, 22:00, 02:00, 06:00, 10:00 and 14:00 New York). On the clock (New York) counts on the hour from New York midnight (00:00, 04:00, 08:00 and so on). At a time I choose counts from a New York time you set, for example 4-hour candles from 01:00. A candle never runs across the daily close.

Day starts at picks Exchange, NinjaTrader’s own trading day (on CME futures it opens at 18:00 New York the evening before), or New York midnight, the ICT “true day” from 00:00 to 00:00 New York, with Sunday evening’s trading counted in Monday’s candle. Weekly and monthly candles always follow the exchange’s trading days, like NinjaTrader’s own weekly and monthly charts.

One pick sets it up. Timeframe preset fills the rows for a Scalper, Day trader, Swing or CRT chart, and the seventy-four settings in thirteen sections below fine-tune the rest. The names in bold are the names in the indicator’s settings window.

Four rows, each its own timeframe

Rows 1 to 4 each have Show, Timeframe (Automatic from your chart, 5 minutes to 12 hours, Daily, Weekly, Monthly or Custom minutes from 2 to 1439), Candles in the stack (4 by default, 1 to 40), Market (type e.g. NQ) and Candle start. Timeframe preset fills them in one pick: Automatic from my chart, Scalper, Day trader, Swing or CRT. By default rows 1 to 3 are on, picked from your bar size (15 minutes, 1 hour and 4 hours on a 1-minute chart); row 4 waits as a Daily row.

When a candle and a day begin

Candle start offers Like NinjaTrader (the candles of a NinjaTrader chart of that size on your trading hours), On the clock (New York) counted on the hour from New York midnight, or At a time I choose from your Custom start time. Day starts at picks the exchange’s trading day or New York midnight, and Times shown in writes every time in your chart’s clock or New York time.

What it draws, switch by switch

Section 02 holds PO3 stack (off by default), Candles over the bars with Body opacity (%) 15 and Outline and wick opacity (%) 60, Open line, Previous candle lines (high and low, or high, low and 50%), Candle start lines and Sweep marks (in the stack, or also over the bars). Rows drawn over the bars and Days to show (5 by default) set how much is drawn over your bars.

The PO3 stack, where and how big

Position puts it right of price at your chart’s prices, or in a box in one of the four corners with Box height (pixels). Candle width (pixels) (0 = as wide as your chart’s candles), Space between candles (pixels), Space between rows (pixels) and Distance from price (pixels) set its spacing, and Make room on the right widens your chart’s right margin so it fits, giving your own margin back when the tool leaves.

Labels, countdowns and study mode

Timeframe name and Time left sit above each row of the stack; Candle time, Forming candle prices and Forming candle range (in points or ticks) are off until you want them. Study mode when scrolled back shows the candles as they stood at the right-most bar on screen. Text size 0 uses your chart’s own label size.

Lines and colors

Rows with lines, Line style, Line width, Line color and Line labels (15m O, 1H PH, 1H PL, 1H 50%) set the open line and the previous candle lines. Candle look copies your chart’s own candles or uses Up candle, Down candle, Doji, Outline and the wick settings — changing any of those colors switches it to My colors below by itself; Sweep color colors the sweep marks.

Three alerts, off until you want them

New candle, Previous high or low taken and Close back inside, for the rows set in Rows with alerts, with any .wav file as the Alert sound. They run in real time only and go to NinjaTrader’s Alerts Log, also while the chart sits on a hidden tab.

Yes. Tick PO3 stack, then type its symbol in a row’s Market (type e.g. NQ) box, for example NQ, and that row shows NQ’s candles in the stack on their own price scale. Give another row the same timeframe to see ES and NQ side by side. A symbol alone takes your chart’s contract month when that market rolls on the same date (NQ beside ES), else its own current contract; type the month too (NQ DEC26) to pick one yourself. Over your bars and as lines another market is drawn only when it trades at your chart’s prices, like MES on an ES chart. Your data feed must carry it, and other markets are not loaded on a Tick Replay chart.

A line at the previous candle’s high or low when the next candle trades beyond it, from that candle to the one that took it. Dotted while the candle forms, solid once it has closed back inside that level — the sweep, what traders call a liquidity sweep — and gone when it closed beyond it. The Sweep marks setting shows them in the PO3 stack (the default, so tick PO3 stack to see them) or, set to In the stack and over the bars, also on the candles drawn over your bars (the first row by default).

Three alerts, all off by default, in section 13: New candle when a higher-timeframe candle begins, Previous high or low taken the moment price trades beyond it (once per candle and side), and Close back inside when a candle that took a side has closed back inside the previous candle’s range. They go to NinjaTrader’s Alerts Log with a sound you pick, also while the chart is on a hidden tab, and name the market and the timeframe (a close back inside also names its candle). They run in real time only, and a close back inside is reported at the first trade after the candle closed.

No. A finished higher-timeframe candle stays as it closed; only the forming candle moves, as on any chart, until its time is up. A sweep mark is dotted while its candle forms, turns solid if the candle closes back inside the level and goes away if it closes beyond it, so a solid mark is settled. Alerts come in real time only, never from old bars.

NinjaTrader 8 can add a second timeframe to a chart as another data series (right-click the chart, Data Series, Add), but each bigger bar is drawn at its close time as one bar among your small ones. HTF Candle Overlay leaves your chart as it is and draws each higher-timeframe candle see-through over the bars that traded during its time, with the PO3 stack beside price and the time left in each candle.

Two numbers in section 02: Body opacity (%), 15 by default (0 draws only the outline and the wick, 100 is solid), and Outline and wick opacity (%), 60 by default. Screens and chart colors differ, so set what reads best on yours. Candle look in section 11 copies your chart’s own candles or uses your colors; changing a color there switches it to your colors by itself.

With Day starts at on Exchange and your chart on the market’s own trading hours, its open, high and low, yes. Its close is the day’s last trade wherever the tool holds the day’s 1-minute data (on a Tick Replay chart the last two days), so a sweep mark or an alert does not change when you reload the chart; NinjaTrader’s own daily bar can show your provider’s settlement price instead, and older days use NinjaTrader’s daily close. A regular-hours chart gets regular-hours days.

Yes, scroll the chart back. With Study mode when scrolled back on (the default), the candles over your bars and the stack show the higher-timeframe candles as they stood at the right-most bar on screen — the forming candle too — and an “as of” heading over the stack says when. It runs in NinjaTrader’s Playback as well, as in the video above. Off, the tool always shows the latest candles.

Not at its defaults. It loads NinjaTrader’s 1-minute and daily data once and draws only what is on screen. On a Tick Replay chart NinjaTrader replays every added series tick by tick, so the tool keeps about two trading days of 1-minute data there and says so. If your chart ever lags with it on, email us. That’s a bug, not normal.

Email support, answered by the traders who built it. Bugs get fixed — this tool gets the same updates and support as our paid indicators.

The higher timeframe, on the chart you trade.

Free, no card, no license key. Download it, import it, and higher‑timeframe candles are over your bars in under a minute. One tick in the settings adds the PO3 stack beside price.

Not for you if you trade Kagi or point-and-figure charts, or monthly and yearly bars. HTF Candle Overlay works on every other NinjaTrader chart; the trade is yours.

Pairs well with Multi-timeframe trend indicator (MultiTrend) · Free session high low indicator (Session Colors) · Free previous day high and low indicator (Daily H/L Lines) · Free bar timer countdown indicator (Tick/Time Counter)

We also offer custom builds

Can’t find the tool you need? We’ll build it.

Tell us what you want to see on the chart. You get a fixed price and a written plan before any work starts.

Request a free quote

Every tool on this site started as an idea like yours.

A key levels indicator we built, on a NinjaTrader chart A moving-average zones indicator we built, on a NinjaTrader chart A VWAP indicator we built, on a NinjaTrader chart