SessionLevels

$29
Built for the European trading day NinjaTrader 8 Indicator Asian, London, US RTH and Initial Balance session levels, or your own custom sessions, on your clock
No machine ID Nothing to activate Your own time zone No repaint Instant download Free updates Verified on NinjaTrader 8.1.8.2 · 16 Sep 2026
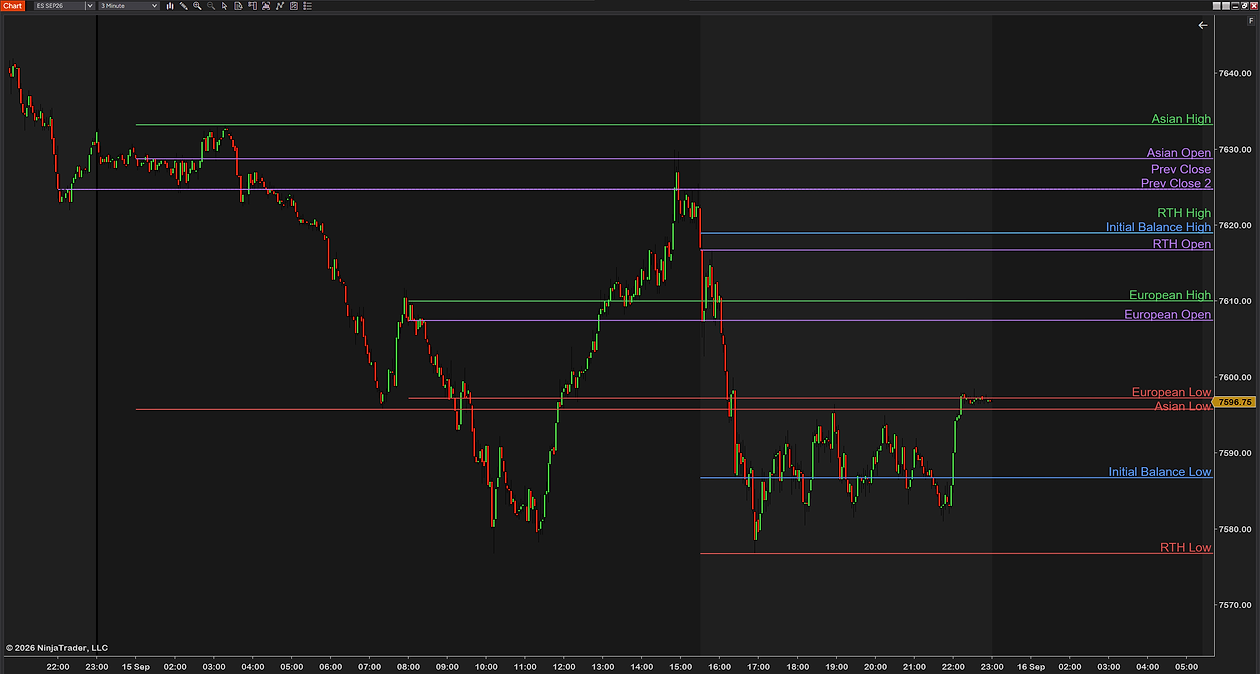
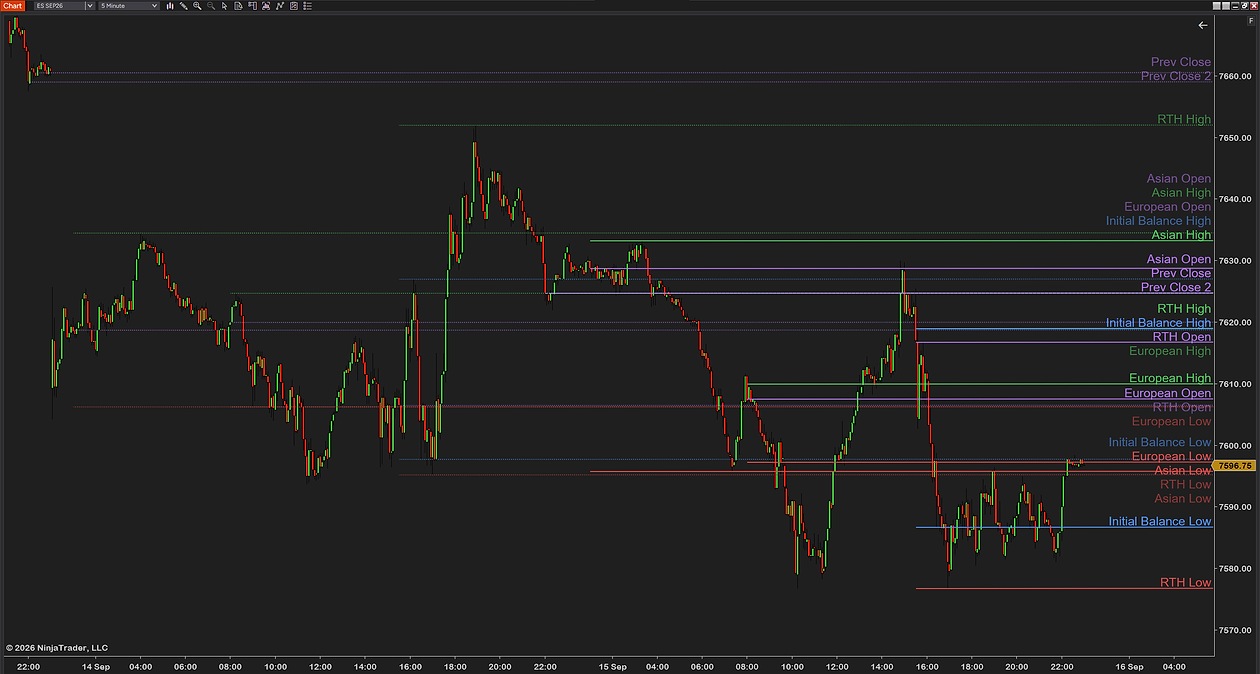
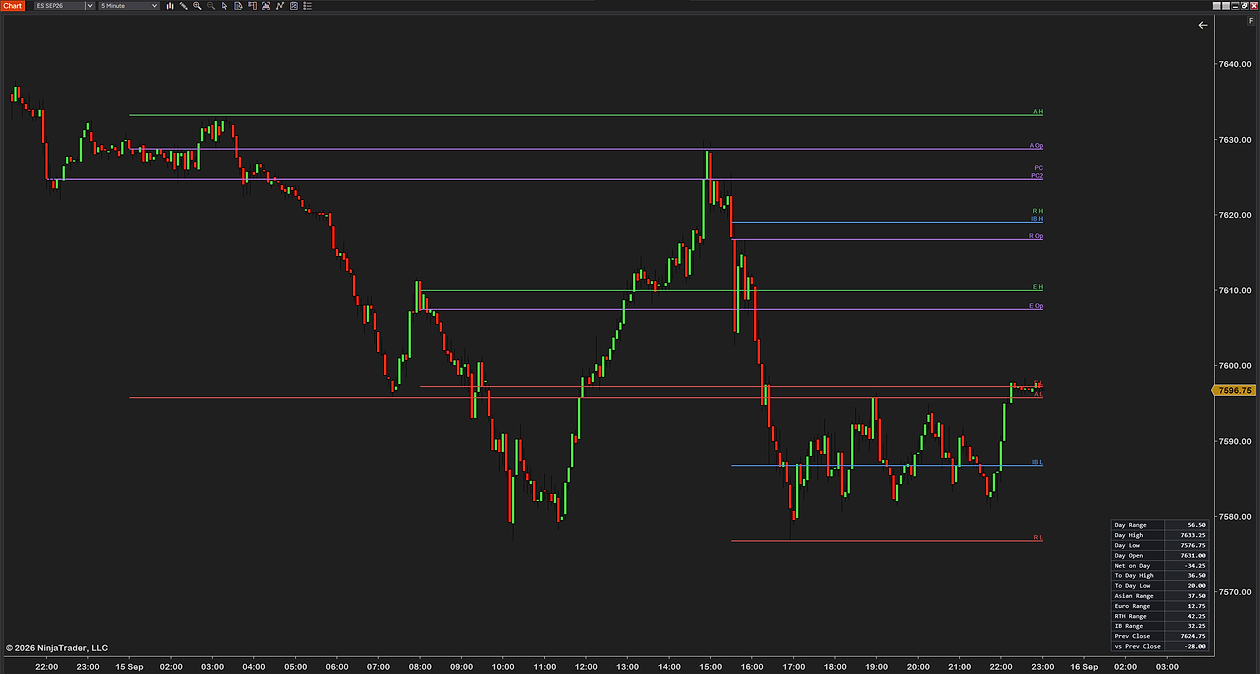
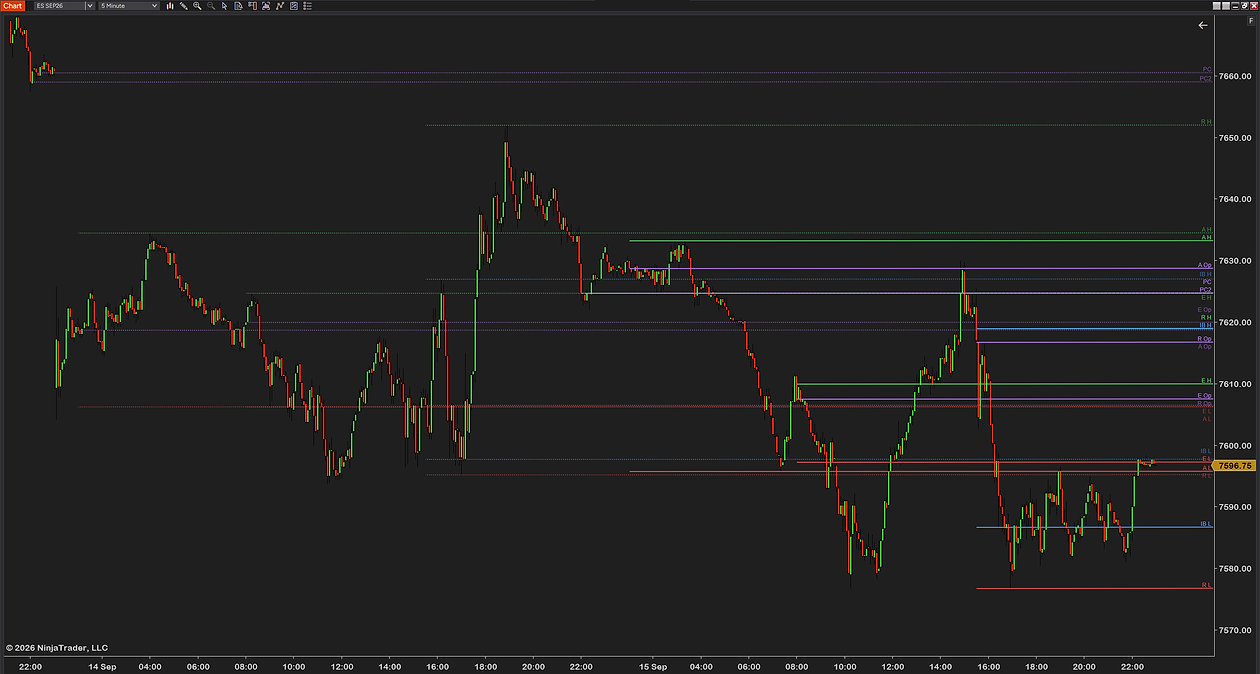
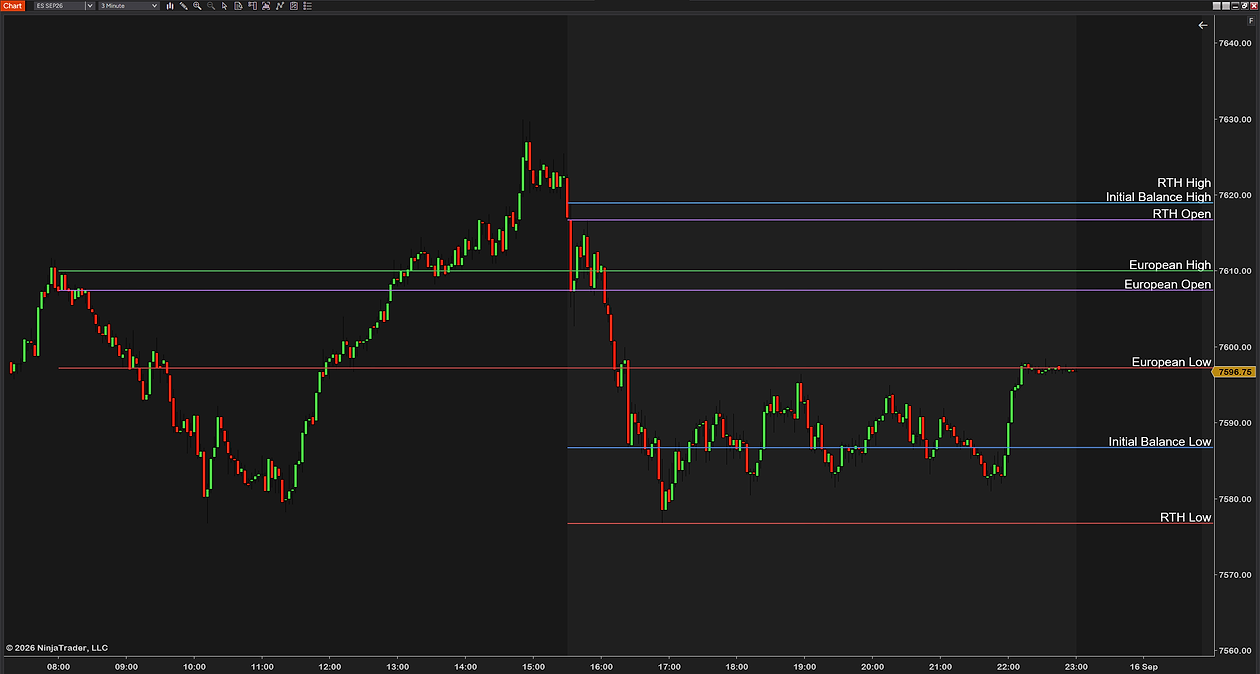
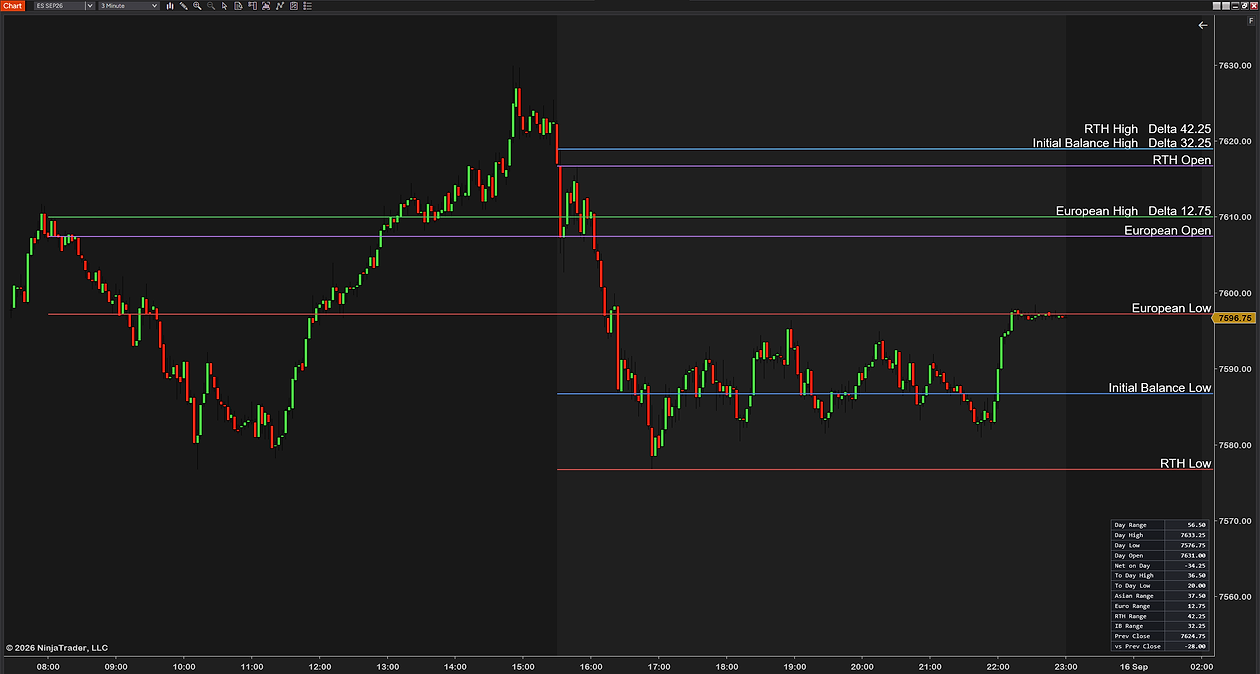
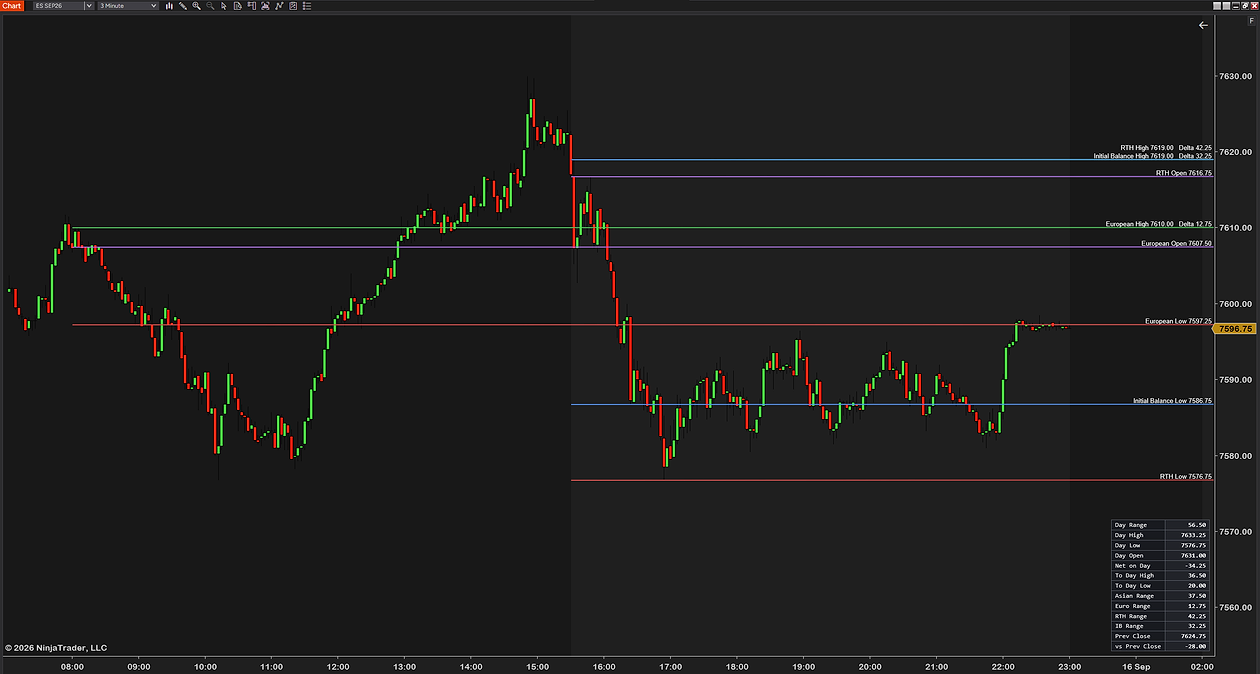
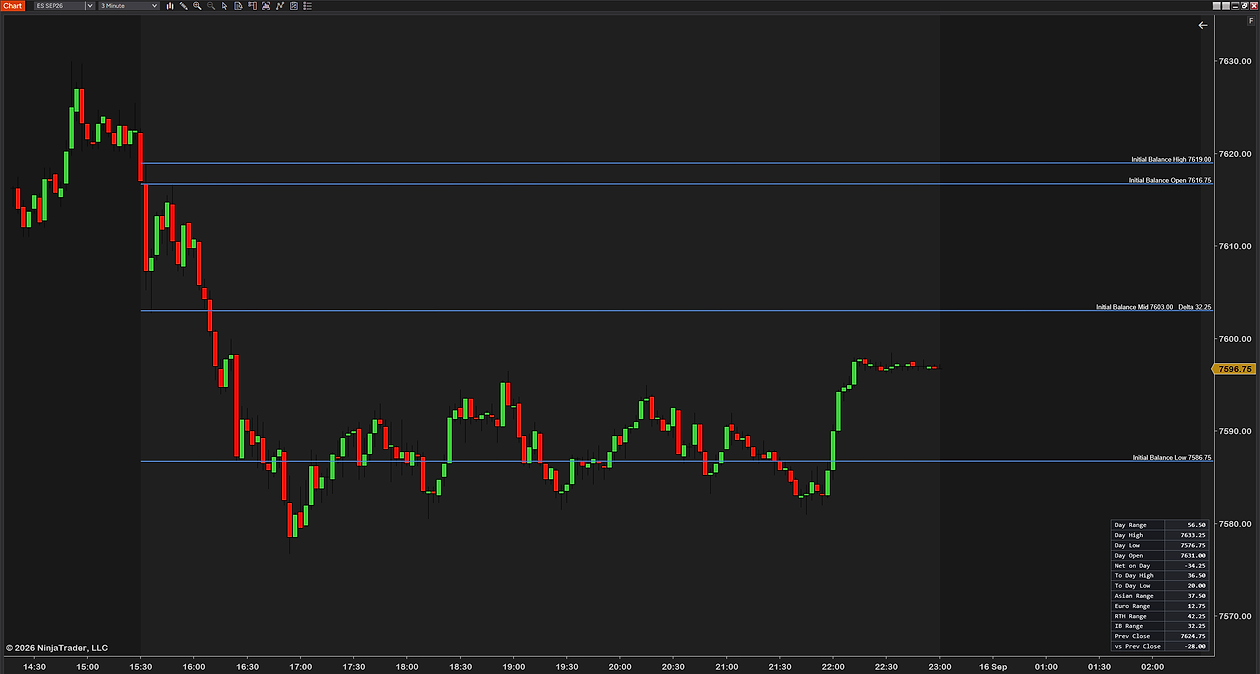
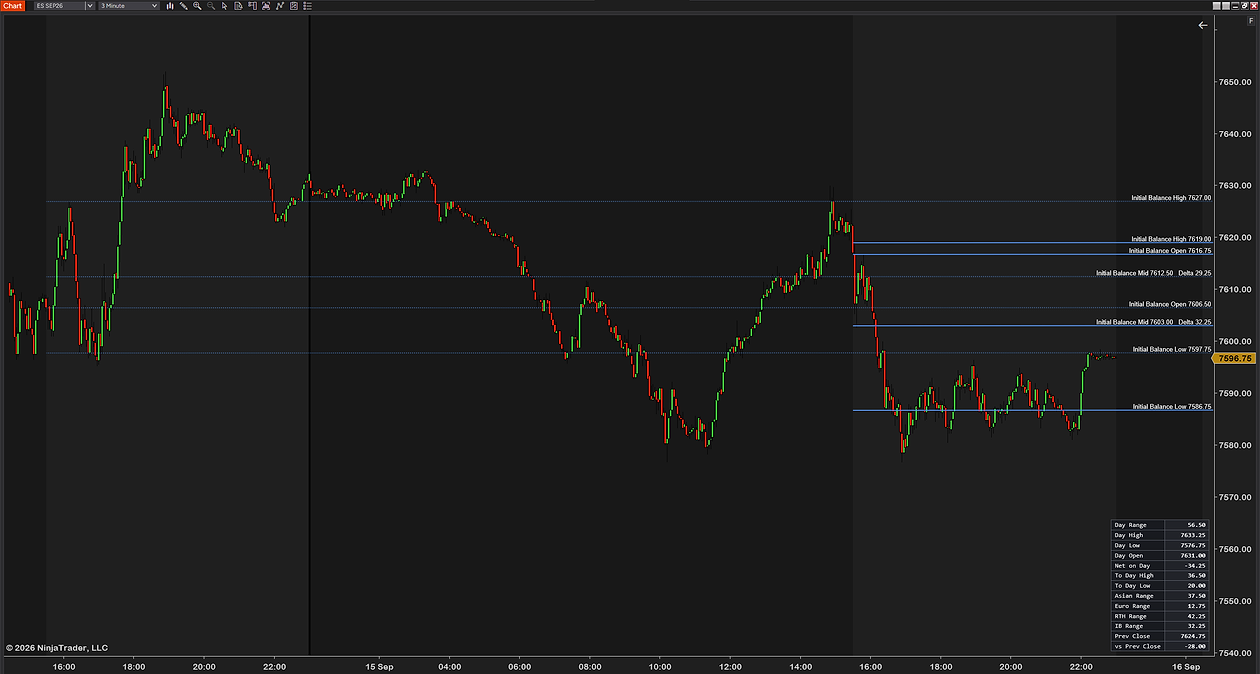
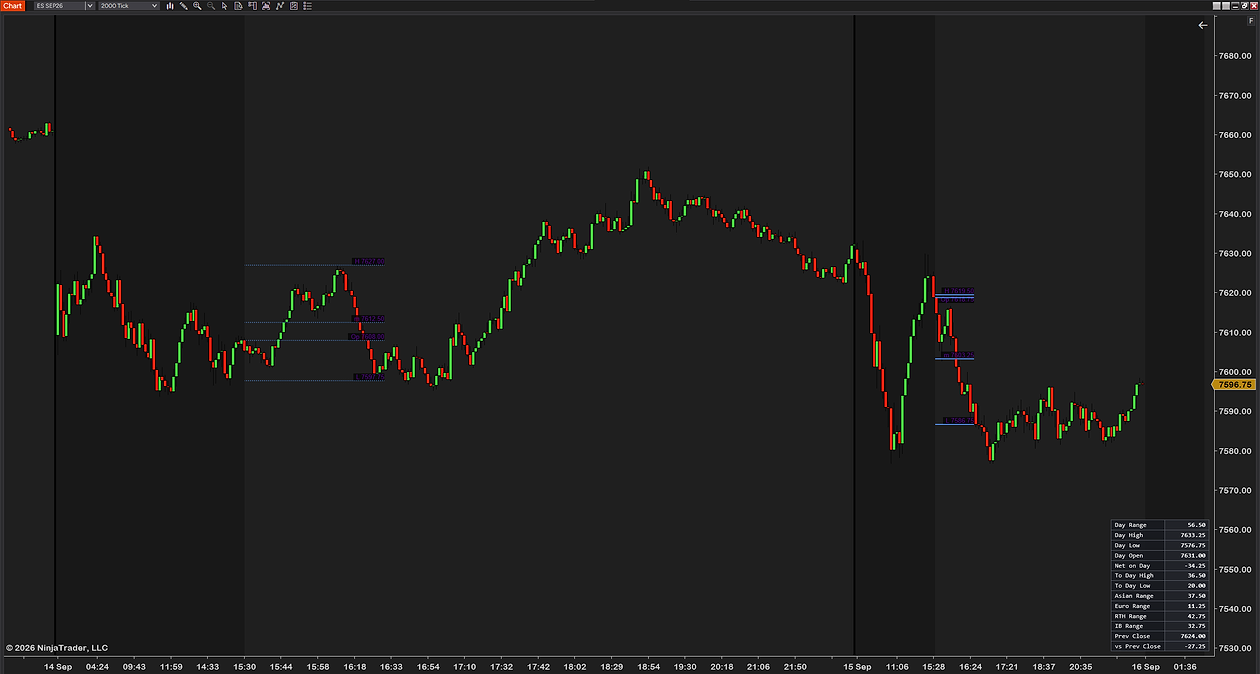
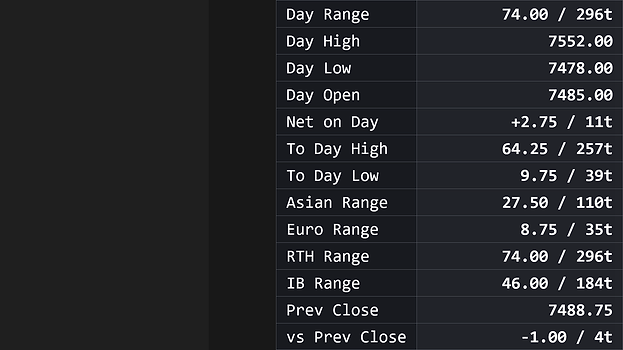
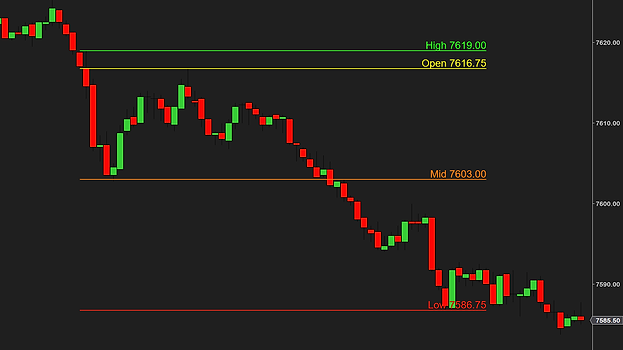
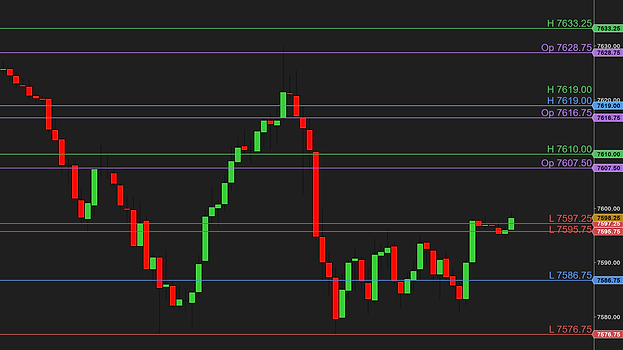
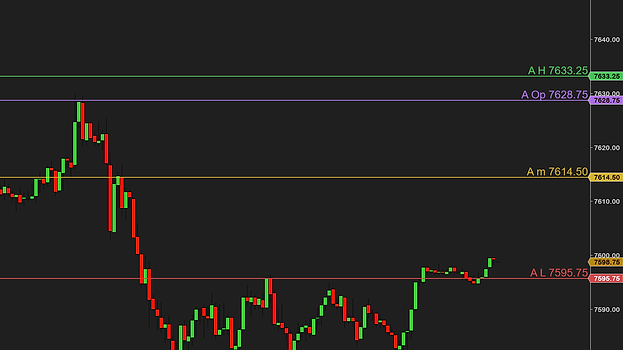
SessionLevels on a 3-minute ES chart with full label names, from the 22:00 close of the day before to 05:00: Asian High, Asian Open, both Prev Close lines, RTH High, Initial Balance High, RTH Open, European High and Open, the Asian and European lows, Initial Balance Low and RTH Low SessionLevels with full label names — Prev Close, RTH High, Asian Open, European Low, Initial Balance High — across two days on a 5-minute ES chart, yesterday’s levels dotted SessionLevels on a 5-minute ES chart with the shipped defaults: the Asian, European, US RTH and Initial Balance open, high and low lines with short-code labels (A H, A Op, E H, R Op, IB L, R L), both previous-close lines (PC, PC2) and the range panel bottom right SessionLevels across two trading days on a 5-minute ES chart: yesterday’s session levels dotted behind today’s solid ones, every line with its short-code label at the right edge SessionLevels on a 3-minute ES chart from 08:00 onward: the European open, high and low, the RTH open, high and low and the Initial Balance high and low, each labeled in full SessionLevels with each session’s range printed on its label — RTH High Delta 42.25, Initial Balance High Delta 32.25, European High Delta 12.75 — and the range panel bottom right, 3-minute ES SessionLevels with the price and the range on every label — RTH High 7619.00 Delta 42.25, RTH Open 7616.75, European Low 7597.25, RTH Low 7576.75 — and the range panel, 3-minute ES SessionLevels showing the Initial Balance alone on a 3-minute ES chart: Initial Balance High 7619.00, Open 7616.75, Mid 7603.00 with Delta 32.25, and Low 7586.75, from 14:30 to 02:00 SessionLevels showing two days of Initial Balance levels on a 3-minute ES chart, yesterday’s high, open, mid and low dotted behind today’s solid ones, with the range panel SessionLevels in session-only mode on a 2000-tick ES chart across two days: each Initial Balance line drawn only for the length of its own window, with the range panel bottom right
1 / 10

Customizable start/end times for all sessions

Asian session01:00 to 09:00 by default

A Op (Asian open) on by default
A H (Asian high) on by default
A L (Asian low) on by default
A m (Asian median) off by default

European opening range08:00 to 09:00 by default

E Op (European open) on by default
E H (European high) on by default
E L (European low) on by default
E m (European median) off by default

US regular session15:30 to 22:00 by default

R Op (RTH open) on by default
R H (RTH high) on by default
R L (RTH low) on by default
R m (RTH median) off by default

US Initial Balancethe first hour of RTH, 15:30 to 16:30 by default

IB Op (Initial Balance open) off by default
IB H (Initial Balance high) on by default
IB L (Initial Balance low) on by default
IB m (Initial Balance median) off by default

Previous closesyesterday’s price at the hour you choose

PC (Prev close, 22:15) on by default
PC2 (Prev close 2, 22:00) on by default

Standard session tools vs SessionLevels.

The levels Standard tools SessionLevels
Session open, high and low most tools one session, often just high and low; here four, each with its open✓✓
Four session windows at once Asian, European, US RTH and Initial Balance on one chart, one indicator✓
Medians and the Initial Balance open each its own line, on or off✓
Yesterday’s sessions behind today’s some tools; here dotted, without a second copy of the indicator✓✓
Closes and ranges
A previous-close line at any hour most tools fix the hour; here 22:15, or whatever you type✓✓
A second close line you can drag 22:00 and 22:15 on the chart at once✓
Each session’s range on its label points, ticks or both, printed next to the level✓
Live range panel 13 measurements — day range, net on day, distance to high and low, session ranges✓
Time
Times typed in your own zone most tools follow the chart or New York; here six zones to pick from✓
Daylight saving handled by each zone’s own rule, so 15:30 CET stays 15:30 CET all year✓
Sessions that cross midnight 23:00 to 07:00 is a valid window; many tools refuse it✓
Yours to set
Every line its own color, style and width most tools per plot; here 18 lines, with opacity and label too✓✓
Short codes, full names or the price A H · Asian High · 7517.50✓
English or Italian label words Apertura, Massimo, Minimo, Mediana✓
Lines as long as you want to the right edge, the current bar, the whole chart, or their own session✓✓
117 settings across 12 groups every default is a starting point, not a limit✓
Built-in diagnostics report recomputes and grades every level; paste it to support✓
Works on
Chart types
Minuteexact session opens
Tickany count
Volumeany size
Rangeany size
Instruments
FuturesES, NQ and DAX verified
Stocksand ETFs
Cryptoany intraday feed
Data providerany
Needs
NinjaTrader 88.1.8 or newer, free included
DataLevel 1 is enough
Order Flow +not needed
Machine IDnone

In short: NinjaTrader 8 and an intraday chart. That is all SessionLevels needs.

Intraday charts only: on daily or higher bars it shows a notice instead of guessing. On tick, volume and range bars a session open comes from the first bar inside the window, so it can sit one bar after the exact minute; on minute charts it is exact.

Get SessionLevels on your chart

All plans give you instant access to SessionLevels, ready to use right away. No machine ID, nothing to activate.

14 day free trial

$0/14 days

Ends by itself. Nothing to cancel, nothing charged.

Start free trial
Included:
  • Every setting of the paid version
  • All four sessions and both close lines
  • The range panel and the session deltas
  • No card required
  • No activation step
  • Same install as the full version

Licensed through NinjaTrader’s vendor licensing.

Buy now

$29/once

One-time payment, lifetime license.

Buy now
Everything in the trial, plus:
  • Yours to keep — no renewal, no expiry
  • One license — every computer you own
  • Free updates
  • Support by email, from the traders who built it
  • 14-day money-back guarantee
  • Instant download after checkout

Secure checkout via Creem. Price includes tax.

Monthly subscription

$2.99/mo

Billed monthly. Cancel any time.

Subscribe
While subscribed:
  • Every setting of the paid version
  • One license — every computer you own
  • Free updates while subscribed
  • Support by email, from the traders who built it
  • Cancel any time
  • Instant download after checkout

Secure checkout via Creem. Price includes tax.

How traders use it

Four references the European day is built around, drawn before you sit down. None of them is a signal; the entries, the stops and the discipline are still yours.

Opening rangeThe hour before the cash open

The 08:00 to 09:00 range, the hour into the European cash open, is drawn as it forms. Trade the break, or the return into it, with the high and the low already on the chart and the range printed beside them.

OvernightThe Asian box

Where price sits at the European open, relative to the Asian high and low, is the first read of the day. Inside means balance so far; outside means someone already moved it.

Initial balanceThe first hour of New York

The IB high and low frame the US session. An extension past either one, or a day that never leaves them, tells you what kind of day you are in.

Prev closeThe 22:15 reference

Yesterday’s 16:15 New York close, and the 16:00 cash close beside it, are where the overnight is measured from. Price returning to them, or gapping away, is a reference every single day.

New to sessions? Read the trading hours and time zones guide →

Why choose us.

61+Countries(all products)
4.8/5★Average rating(all products)

Free trial on every paid product. Full refund within 14 days. Custom changes on request. Very few NinjaTrader 8 vendors offer all three. We do it for one reason: you should never have to pay to find out whether a tool works on your chart. Most of our tools are free. The paid ones are extensively tested, kept up to date and priced well below the usual rate. We would rather earn a customer who comes back than make a sale that does not last. Questions? Email [email protected]. We answer fast.

260+Traders(all products)
700+Downloads(all products)
World map with every country running UsefulIndicators highlighted

What our customers are saying

Frequent questions.

Question or idea for improvement? Email us, we reply fast.

Download the zip after checkout, then in NinjaTrader 8 go to Tools → Import → NinjaScript Add-On and pick the file. Add SessionLevels to any intraday chart from the Indicators list and the lines are there — most traders are done in under a minute. Nothing to activate, no machine ID. The step-by-step guide covers every message NinjaTrader can show and the update rule.

Yes, all of them. Each of the four windows has its own start and end, typed as HH:MM in the time zone you choose, and nothing is hardcoded. The defaults are the European trader’s day — Asian 01:00 to 09:00, the European opening range 08:00 to 09:00, US RTH 15:30 to 22:00 and the Initial Balance 15:30 to 16:30, all in Central European time — but a window can be any hours you like, including one that crosses midnight, and a window you do not want is one switch off.

Your own. The first setting, My session times are in, offers Central European (Rome, Berlin, Paris), London, New York, Chicago, UTC, or the chart’s own time axis. Every time you type is read in that zone and converted to the chart automatically, daylight saving included, so 15:30 CET stays 15:30 CET all year.

One honest caveat: for about two weeks each March and one each autumn, the US and Europe change their clocks on different dates. A US session typed in European time sits an hour off the US clock during those weeks. If that matters to you, type the US windows in New York time — the zone applies to all four windows in this version, so choose the clock your day is built around.

Yesterday’s price at an hour you choose, drawn across today. The first ships at 22:15 European, the 16:15 New York index-futures close; the second at 22:00, the 16:00 cash close — a point or two apart on most days, and on some days the difference is the whole story. The second line can also be dragged up or down with the mouse to mark a level of your own; it stays tied to its time, snaps back if you drag it sideways, and returns to the true close on the next trading day or when you click OK in the settings.

No. A session that has ended has its lines fixed, and yesterday’s lines never move. The one session still trading behaves the way a range does: its high and low extend outward when a new extreme prints, and the median follows them. Nothing is ever redrawn behind you, and a level the indicator cannot know for certain — a window that starts before the loaded history — is left off rather than guessed.

On any intraday chart: minute, tick, volume and range, on any instrument, from any data provider. It was built and verified on ES, NQ and DAX futures on 1-minute charts, where every session open is exact; on tick, volume and range bars the open comes from the first bar inside the window, so it can sit one bar after the exact minute. On daily or higher bars it shows a notice and draws nothing, because session levels need intraday bars.

No, and we won’t pretend it is. It is a reference tool: it draws the levels the day is built around — where each session opened and how far it ranged — so you are not drawing them by hand every morning. What you do at those levels is yours.

No. SessionLevels never touches your orders, positions or account. It draws on the chart, and that is all it does — every order is yours to place, in your own order-entry window, exactly as before.

It’s built lean: no work is done on historical bars while the chart loads, the level scan never looks at more than 60,000 bars however much history you load, and only the last day or two of them do any real work. If your chart ever lags with it on, email us: that’s a bug, not normal.

Email support, answered by the traders who built it. If a level looks wrong, switch on the built-in diagnostics and send us the report it writes to the Output window — it recomputes every level independently and grades each check, so we see exactly what your chart saw. Bugs get fixed, and updates are free.

The Nerd Vault

How a window on your clock becomes four lines on the chart, and what is left off on purpose.
How it’s calculated
Window = start < bar ≤ end

Each session is a start and an end time typed in the zone you chose. Both are converted to the chart’s clock for the day being drawn, daylight saving included, and a bar belongs to the window when its close stamp falls inside it — the same rule NinjaTrader uses to stamp the bar itself. A window whose end is earlier than its start crosses midnight and is anchored to the day it ends on.

Level = open, high, low, (H + L) ÷ 2

The open is the first bar inside the window, the high and low are its extremes, and the median is halfway between them, rounded to the instrument’s tick. While the window is still trading the high and low extend outward as new extremes print; once it ends, all four are fixed. The range is high minus low, in points, ticks or both, and rides one of the session’s own labels so it never floats on its own.

Prev close = yesterday’s bar at HH:MM

The close line is the closing price of the last bar at or before the hour you set, on the previous weekday — Monday reads Friday. Two of them ship: 22:15 European, the 16:15 New York index-futures close, and 22:00, the cash close, each with its own hour.

Hover a term to see it in the drawing and the table
Opens · closesHighsLowsInitial Balanceproduct default colors
ONE DAY ON THE CET CLOCK · ES, 20 JULY 2026 · LAST 7486.25 AT 22:00 EACH LINE STARTS WHERE ITS LEVEL WAS SET AND RUNS TO THE CURRENT BAR 75607540752075007480 00:0006:0012:0018:0022:00 ASIAN 01:00–09:00EURO 08–09RTH 15:30–22:00IB 15:30–16:30 A 27.50 E 9.00 IB 46.25 R 74.25 R H·IB HR OpA HIB LE HE/A OpE/A LPCR L A WINDOW THE HISTORY DOES NOT COVER IS LEFT OFF, NEVER BUILT FROM PARTIAL DATA HOVER “RANGE” FOR THE HIGH-TO-LOW NUMBERS · MEDIANS AND THE 22:00 CLOSE NOT DRAWN One day drawn from the worked example below, in the product’s default colors. The price path between the levels is illustrative; the levels, the windows and the close are the capture’s. Medians (off by default) and the 22:00 close (added in 1.1, after this capture) are not drawn.
Worked example · the levels on the 1-minute ES capture of 20 July, times in CETPrices to the tick · ranges in points and ticks · medians rounded to the tick
LineWindowRuleValueRange
A Op · A H · A LAsian, 01:00–09:00first bar’s open, then the extremes7496.00 · 7517.50 · 7490.0027.50 / 110t
A mAsian(7517.50 + 7490.00) ÷ 27503.75—
E Op · E H · E LEuropean, 08:00–09:00first bar’s open, then the extremes7496.25 · 7499.75 · 7490.759.00 / 36t
E mEuropean(7499.75 + 7490.75) ÷ 27495.25—
R Op · R H · R LUS RTH, 15:30–22:00first bar’s open, then the extremes7534.25 · 7552.25 · 7478.0074.25 / 297t
R mUS RTH(7552.25 + 7478.00) ÷ 2, to the tick7515.25—
IB H · IB LInitial Balance, 15:30–16:30the extremes of the first RTH hour7552.25 · 7506.0046.25 / 185t
IB OpInitial Balancesame bar as R Op, so it ships off7534.25—
PCyesterday at 22:15last bar ≤ 22:15 on 17 July7488.50—
Daymidnight to midnightthe panel’s open, high, low of the day7484.50 · 7552.25 · 7478.0074.25 / 297t

The Asian and European lows sit three ticks apart and the two opens one tick apart, which is why the labels are spaced automatically while the lines stay exactly on their prices. The day rows run from local midnight, so the day open is the open of the first bar after 00:00. The range panel pictured in the gallery is a different capture, a 15-minute ES chart, so its numbers differ from this table by a tick here and there.

Your clock, converted

Times are literal in the zone you pick: 15:30 Central European means 15:30 CET or CEST all year, and the conversion to the chart is done fresh for every day drawn. In the weeks when the US and Europe change their clocks on different dates, a US session typed in European time is an hour off the US clock; type it in New York time if that matters. One zone serves all four windows in this version.

Drops, never fabricates

A window that starts before the loaded history is left off, not built from the bars that happen to be there: its open would be wrong and its high and low incomplete. Load one more day in the Data Series dialog and it appears. The panel’s day rows follow the same rule and are omitted until the whole day is covered.

Yesterday, on weekdays

Weekends are skipped: Monday’s “yesterday” is Friday, so its close line and Friday’s dimmed lines are what Monday shows. On Sunday-evening bars, when the futures reopen, the chart still shows Friday’s sessions, because those are the last completed ones; the level set rolls forward at local midnight.

Labels that never overlap

When two levels land a tick apart — the European and Asian opens on the capture — the labels are spaced apart automatically while the lines stay exactly on their prices, and the label nearest a shared price takes the color of the line drawn on top. Codes, names, the price or your own text; above, on or below the line; with or without a box.

This is the actual settings panel in NinjaTrader — numbered groups, plain-English names, and a hover text on every row. Each session is its own group: its times, its names, four switches and four lines; every “line” row expands to color, opacity, style, width and label text.

SettingDefaultRange
General
LanguageEnglishEnglish · Italiano
My session times are inCET Rome Berlin ParisCET Rome Berlin Paris · UK London · US Eastern New York · US Central Chicago · UTC · Chart Time
Line extensionTo Current BarTo Current Bar · Right Ray · Full Width · Session Only
Labels
Show labelsOnOn · Off
Show priceOffOn · Off
Name styleSession ShortNone · Level Short · Level Full · Session Short · Session Full
Font familyArialArial · Consolas · Courier New · Tahoma · Verdana · Segoe UI
Font size126 – 72
Label placementAboveAbove · On · Below
Label colorMatch LineMatch Line · Custom
Custom label colorWhiteAny color
Label box color#000000 at 78%Any color
Show label boxOffOn · Off
Deltas & Panel
Show panelOnOn · Off
Session deltas on linesOffOn · Off
Show delta onAutoAuto · High Line · Low Line · Median Line · Open Line
Delta unitPointsPoints · Ticks · Points And Ticks
CornerBottom RightBottom Left · Bottom Right · Top Left · Top Right
Offset X80 – 2000
Offset Y80 – 2000
Font familyConsolasArial · Consolas · Courier New · Tahoma · Verdana · Segoe UI
Font size136 – 72
Row styleGridGrid · Rounded
Box opacity %900 – 100
Text colorWhiteAny color
Background color#14161CAny color
Value column color#1E2128Any color
Border color#5A5F69Any color
Panel Measurements
Day range (H-L)OnOn · Off
Day highOnOn · Off
Day lowOnOn · Off
Day openOnOn · Off
Net on dayOffOn · Off
Distance to day highOffOn · Off
Distance to day lowOffOn · Off
Asian rangeOffOn · Off
European rangeOffOn · Off
RTH rangeOffOn · Off
Initial Balance rangeOffOn · Off
Prev closeOffOn · Off
Distance to prev closeOffOn · Off
Yesterday
Show yesterdayOffOn · Off
Yesterday line styleDottedDotted · Dashed · Same As Today
Opacity %550 – 100
Show yesterday’s labelsOnOn · Off
Show Asian yesterdayOnOn · Off
Show European yesterdayOnOn · Off
Show US RTH yesterdayOnOn · Off
Show Initial Balance yesterdayOnOn · Off
Show Prev Close yesterdayOnOn · Off
Show Prev Close 2 yesterdayOnOn · Off
Asian Session
Show Asian sessionOnOn · Off
Start time01:00
End time09:00
Short codeA
Full nameAsian
Show OpenOnOn · Off
Show HighOnOn · Off
Show LowOnOn · Off
Show MedianOffOn · Off
Open line#BE78FF at 86% · Solid · 2 pxAny color, opacity, style, width and label text
High line#46D25A at 90% · Solid · 2 pxAny color, opacity, style, width and label text
Low line#E64646 at 90% · Solid · 2 pxAny color, opacity, style, width and label text
Median line#F0C828 at 86% · Solid · 2 pxAny color, opacity, style, width and label text
European Session
Show European sessionOnOn · Off
Start time08:00
End time09:00
Short codeE
Full nameEuropean
Show OpenOnOn · Off
Show HighOnOn · Off
Show LowOnOn · Off
Show MedianOffOn · Off
Open line#BE78FF at 86% · Solid · 2 pxAny color, opacity, style, width and label text
High line#46D25A at 90% · Solid · 2 pxAny color, opacity, style, width and label text
Low line#E64646 at 90% · Solid · 2 pxAny color, opacity, style, width and label text
Median line#F0C828 at 86% · Solid · 2 pxAny color, opacity, style, width and label text
US RTH Session
Show US RTH sessionOnOn · Off
Start time15:30
End time22:00
Short codeR
Full nameRTH
Show OpenOnOn · Off
Show HighOnOn · Off
Show LowOnOn · Off
Show MedianOffOn · Off
Open line#BE78FF at 86% · Solid · 2 pxAny color, opacity, style, width and label text
High line#46D25A at 90% · Solid · 2 pxAny color, opacity, style, width and label text
Low line#E64646 at 90% · Solid · 2 pxAny color, opacity, style, width and label text
Median line#F0C828 at 86% · Solid · 2 pxAny color, opacity, style, width and label text
US Initial Balance
Show Initial BalanceOnOn · Off
Start time15:30
End time16:30
Short codeIB
Full nameInitial Balance
Show OpenOffOn · Off
Show HighOnOn · Off
Show LowOnOn · Off
Show MedianOffOn · Off
Open line#4696FF at 90% · Solid · 2 pxAny color, opacity, style, width and label text
High line#4696FF at 90% · Solid · 2 pxAny color, opacity, style, width and label text
Low line#4696FF at 90% · Solid · 2 pxAny color, opacity, style, width and label text
Median line#4696FF at 90% · Solid · 2 pxAny color, opacity, style, width and label text
Prev Close
Show prev closeOnOn · Off
Close time22:15
Short codePC
Full namePrev Close
Prev close line#BE78FF at 90% · Solid · 2 pxAny color, opacity, style, width and label text
Prev Close 2
Show prev close 2OnOn · Off
Close time22:00
Short codePC2
Full namePrev Close 2
Prev close 2 line#BE78FF at 90% · Dash · 2 pxAny color, opacity, style, width and label text
Diagnostics
Enable diagnostics dumpOffOn · Off
Days to verify51 – 10
Dump all settingsOffOn · Off
Run self-testsOffOn · Off

Ranges are printed only where the indicator enforces one. Times are HH:MM in the zone you chose; line colors carry their default opacity; every color accepts any color. The Diagnostics group is a support tool and ships off.

Nothing is computed on historical bars while the chart loads: the level set is built once from a single scan back from the current bar that never looks at more than 60,000 bars however much history you load, and only the last day or two of them do any real work. After that, a tick only updates the one window that is still trading, and the lines are redrawn once per new bar. The labels and the panel are drawn in one pass per frame, with their text formats and column widths cached until a setting changes. It pauses in a background tab and catches up when you return. If your chart ever lags with SessionLevels on, that is a bug and we want to hear about it.

Prev close 2 can be dragged up or down with the mouse, like any NinjaTrader line, to mark a level of your own for the day. It is meant to change the price, not the time: a sideways drag is undone on the next repaint and the line returns to its close hour at the price you chose. The override is for the trading day only — a new day re-plots the line at the true close — and opening the settings and clicking OK does the same at any time. Yesterday’s copy of the line is never draggable. Give the line your own name in its Label text before you drag, because the settings dialog re-seeds it.

The file
SessionLevels_v1.2.zip, 210 KB. A standard NinjaScript add-on: Tools → Import in NinjaTrader 8, nothing else to install. Delivered instantly on the checkout page and in your email receipt.
The license
One-time purchase, yours to keep, tied to your NinjaTrader account through NinjaTrader’s own vendor licensing: no machine ID, nothing to activate, and it follows your account onto every computer you own. The 14-day trial starts by itself the first time the indicator loads and ends by itself.
Updates
Every update is free and installs the same way, over the top of the old one.
Support
Email, answered by the traders who built it. Bugs get fixed. A step-by-step installation guide and the support page are there if you ever need them.
Platform
NinjaTrader 8.1.8 or newer, the free tier included. One license, every computer you own. One-time purchase, free updates.
Chart types
Intraday only: minute, tick, volume and range. On daily or higher bars it shows a notice and draws nothing. On tick, volume and range bars a session open comes from the first bar inside the window, so it can sit one bar after the exact minute; on minute charts it is exact.
Chart clock
The chart is assumed to run on your PC’s clock, NinjaTrader’s default. If you set a named time zone in Tools → Options, choose the ChartTime option and type the times as they read on your chart’s axis. A chart clock far east of the session zone (Tokyo or Sydney with European times) can anchor a window to the day it starts on and freeze its high and low at midnight; not reachable with the defaults on a European clock, so this version is for European-clock charts. The fix is in the works.
Windows across midnight
A window whose end is earlier than its start is anchored to the day it ends on, so it is drawn live only once that day has begun on your clock. With the European defaults no window crosses midnight; an Asia session typed in New York time (18:00 to 03:00) does, and shows only after local midnight. US presets that handle this are in the works.
One zone
All four windows share the one time zone you choose. Through the US and European daylight-saving divergence weeks, a US session typed in European time sits an hour off the US clock.
History
A window the loaded bars do not fully cover is left off; load one more day and it appears. A holiday gap longer than about three days can leave both close lines off until the next trading day.
Ranges
Printed to two decimals, so instruments with ticks finer than 0.01 — currency futures such as 6E — show rounded range numbers.

Switch on Enable diagnostics dump and the indicator writes a verification report to the Output window: every session window and both close lines are recomputed a second time, independently of the drawing engine, straight from the bars, and each boundary and value is graded OK or FAIL — window membership, high above low, open inside the range, the exact bar each close was taken from. Four self-tests cover the label text, the range placement, the label cap and a save-and-reload of every setting. It is how the product was verified before it shipped — 181 checks, zero failures on the release build — and it is what we ask for when something looks wrong on your chart.

SessionLevels makes no network connection of any kind. Everything it draws comes from the bars already on your chart. Nothing about you, your account, your charts or your trades is sent anywhere, and there is no telemetry.

Verification
Runs on
NinjaTrader 8.1.8.2.
Last checked
16 Sep 2026, on our own live charts. The date changes only when the indicator has actually been run on that version.
Current build
v1.2, released 16 Sep 2026. Every update is free.
Audits
Fifteen independent code audits across 1.0 and 1.1, every finding triaged against the code, and the diagnostics harness at 181 checks, zero failures, before each release.
Changelog
v1.2 · 16 Sep 2026
Licensed through NinjaTrader's user-based vendor licensing: the 14-day trial starts by itself the first time the indicator loads, and a purchase is tied to your NinjaTrader account. No machine ID, nothing to activate. No change to what it draws.
v1.1 · 12 Aug 2026
A second previous-close line at its own hour (22:00 by default, beside the 22:15 line), with every option the first line has, and draggable up or down within the day. Renamed SessionLevels (from SessionMap) for the public release.
v1.0 · 20 Jul 2026
Initial release: four session windows (Asian, European opening range, US RTH, Initial Balance) with open, high, low and median lines, a previous-close line at a chosen hour, session ranges in points or ticks, yesterday’s levels dimmed behind today’s, six time zones, English or Italian labels, the live range panel, built-in diagnostics.

See it on your own chart before you decide.

Fourteen days, every setting, no card. If it stays on your chart, it is $29 once and yours to keep.

Not for you if you trade only daily or higher bars (it needs intraday bars), or you only want the open, high and low of your chart’s own session template — NinjaTrader’s built-in Day OHL indicators already draw those for free. This version is built around the European clock: a window that crosses midnight on your clock (an Asia session typed in New York time) appears only after local midnight, and chart clocks far east of Europe are not supported yet. US and Asia-Pacific presets are in the works.

Pairs well with ProVWAP VWAP indicator · Key levels indicator (Intraday Reference Levels) · Free initial balance indicator (Live IB Range)